
Have you heard how there is a much greater probability than generally expected that a statistically significant test outcome is in fact a false positive? In industry jargon: that a variant has been identified as a “winner” when it is not. In demonstrating the above the terms “False Positive Risk” (FPR), “False Findings Rate” (FFR), and “False Positive Report Probability” (FPRP) are usually invoked and they all refer to an identical concept.
What follows is a detailed explanation and exploration of that concept and its multiple proposed applications. False positive risk (FPR) is shown to either not be practically applicable or, when it is, it proves uninteresting due to inferiority to alternatives. Additionally, the proposed equation for calculating FPR is shown to not work and as a consequence previously published FPR estimates are revealed as inaccurate.
False positive risk is further shown as non-useful in setting significance thresholds, power, and sample size during test planning. When used as a post-test statistic FPR is revealed as a complex, non-intuitive, and subjective measure which fails to surface any test-specific information that is not already contained in the p-value.
Table of contents:
- False positive risk versus False positive rate
- Visual relationship between false positive risk and p-values
- The argument for false positive risk
- Estimating the false positive risk of a set of tests
- Issues with current approaches to estimating FPR
- Erroneous FPR estimates
- How insightful is the FPR of a set of A/B tests?
- Using FPR for determining test design parameters
- FPR is not intuitive, nor “what one really wants to know”
- Should statistics of a given test be informed by other tests?
- Summary & conclusions
- Post scriptum: The broader picture
SECTION 1: Explaining False Positive Risk
This section serves as an introduction essential to understanding the arguments to come in sections two and three which deal with applications of false positive risk at the level of sets of A/B tests and at the level of individual experiments. It also presents the argument in favor of using false positive risk.
False positive risk versus False positive rate
Arguments for the utility of false positive risk often contain implicit or explicit conflation of “False positive risk” with “False positive rate”. For example, it may be argued that when a practitioner plans an A/B test with a maximum of say 5% false positive rate what they actually want is to achieve 5% false positive risk. An examination of both concepts shows this conflation to be unwarranted.
What is False positive rate
The false positive rate is the rate at which a statistical testing procedure produces false positives (type I errors). This rate is the probability with which statistically significant outcomes would be observed assuming the null hypothesis is in fact true. As a test design parameter it is denoted by α and a generic formula is:
α = P(d(X) > c(α); H0) (1)
In equation (1) H0 stands for the null hypothesis of interest, c(α) for the critical value corresponding to the selected threshold, while d(X) is a test statistic (distance function). In a post-test context a corresponding concept is the observed level of significance – p-value – the definition of which is identical except c(α) is replaced by the distance function of the observed data x0:
p = P(d(X) ≥ d(x0); H0) (2)
Alpha (α) and the p-value are objective probabilities, one describing how unexpected an outcome should be to count as evidence against the default claim, the other describing how unexpected an outcome or more extreme outcomes are, assuming the same default position. For example, the default claim might be that there is negative or no effect from a tested change. When lower than the target α, a p-value serves as grounds for rejecting the default position it was calculated under.
What is False positive risk
False positive risk, as defined in the “A/B Testing Intuition Busters” 2022 paper by Kohavi, Deng & Vermeer [1] is the probability of a statistically significant outcome to be a false positive. Terms used to describe the same concept in the literature include “false discovery rate” (FDR)[2], “false positive report probability” (FPRP), and “false findings rate” (FFR). The term “false positive risk” was preferred by the authors of the 2022 paper. They borrowed it from Colquhoun 2017 [3] which started using “False Positive Risk” instead of “False Discovery Rate” due to overlap and confusion with the term already established in the famous Benjamini & Hochberg False Discovery Rate which was first covered on this blog many years ago. This article will also predominantly use the term false positive risk (FPR).
While false positive rate is defined as the proportion of statistically significant outcomes assuming a true null hypothesis, false positive risk concerns only tests which have produced a statistically significant outcome as measured by a p-value lower than a target α. On a program-wide level it aims to estimate the proportion of such findings that are false while applied to an individual test it aims to provide a Bayesian probability that the conclusion is false with reference to some set of A/B tests.
A generic formula for false positive risk is the probability:
FPR = P(H0 | d(X) > c(α)) (3)
An expanded version of the FPR equation produced using Bayes’ rule is offered by Kohavi et al. (2022) as:
FPR = (α · π) / (α · π + (1 – β) · (1 – π)) (4)
In the above formula α is the significance threshold, π is a prior probability (not a distribution) for the null hypothesis (π(H0)), and β is the type II error rate evaluated at a particular alternative hypothesis μ1: β(T(α); μ1) = P(d(X) ≤ c(α); μ = μ1).
To get from equation (3) to equation (4), first the Bayes’ formula is used to express equation (3):
P(H0 | SS) = P(SS | H0) · P(H0) / P(SS) (5)
In the above, SS denotes a statistically significant result so P(SS|H0) is the probability of a statistically significant outcome if the null hypothesis is true. This equation expands to:
(P(SS | H0) · P(H0)) / (P(SS | H0) · P(H0) + P(SS | ¬H0) · P(¬H0)) (6)
Equation (4) is then said to follow from equation (6). Issues with this derivation of the final false positive risk formula are discussed in a follow-up section.
Visual relationship between false positive risk and p-values
While formulas are useful, a more visual representation may assist in gaining clarity about the concepts and their building blocks. Figure 1 shows what a p-value calculates and what false positive risk estimates regarding a set of A/B tests.
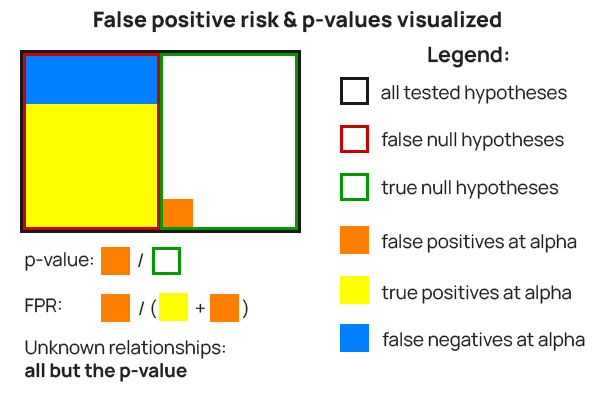
The p-value is the ratio between statistically significant outcomes from tests with a true null hypothesis (orange fill) and the number of such tests (green border). E.g. if a pre-test α of 0.01 (99% confidence) was used, the ratio between false positives (orange fill) and true null hypotheses (green border) would be at most 0.01 (1% false positive rate).
The false positive risk is the proportion of statistically significant outcomes from tests with true nulls (orange fill) from the number of all statistically significant outcomes among all tests (orange fill and yellow fill combined).
It can be observed that false positive risk incorporates the p-value, but also:
- the ratio between true and false null hypotheses among a population of hypotheses – green and red rectangles in Figure 1
- the ratio between true positives and false negatives observed among the false null hypotheses – yellow and blue filled rectangles in Figure 1
The argument for false positive risk
This is a “steel man argument” for the utility of false positive risk based on the Kohavi, Deng, & Vermeer paper, private exchanges with the authors, and their feedback on a previous version of this article for all of which the author is grateful.
False positive risk should be interesting and useful to experimenters as it reflects the percentage of statistically significant A/B tests in which the null hypothesis is in fact true. That is, experiments where an effect is thought to be present based on a sound and valid statistical analysis (p-value < α, relevant confidence interval excluding zero, etc.), but is not. A high false positive risk would mean that a high proportion of assumed improvements and therefore knowledge are in fact not truly so.
Targeting a lower false positive risk is desirable for ensuring a high proportion of findings are indeed at least directionally true so acting on them would be more beneficial. It will also mean that any computation of the gains verified through A/B testing becomes more reliable [2].
One way to achieve low false positive risk is to adjust the significance threshold α based on the equation (4) above. This usually means lowering the target α significantly (i.e. from 0.05 to 0.01 or 0.005). A second way to decrease FPR is to increase the statistical power of A/B tests. Finally, replicating A/B tests with p-values near the chosen significance threshold is also proposed as a way of achieving lower FPR. All of the above should result in a higher replicability of test outcomes and hence higher positive predictive value.
The costs incurred in terms of longer test durations and larger number of exposed users are justified since FPR is the right metric to share with stakeholders. It tells them what they want to know – the probability of a positive outcome being a false one, and it enables risk-reward calculations whereas the simple p-value inherently misleads due to its non-intuitive nature.
In the context of analyzing an individual A/B test FPR is proposed as a measure of how likely the outcome is to be directionally true or not and is to be presented alongside the reported p-value.
SECTION 2: False positive risk of sets of tests
This section discusses false positive risk as a concept at the level of a set of A/B tests, such as those performed as part of an experimentation program, or all tests performed by a business unit, on a product, etc. This is the a favorable scenario for FPR since it can potentially be estimated with sufficient information.
Estimating the false positive risk of a set of tests
For the purpose of illustration, consider a hypothetical set of tests with the following distribution of estimated effect sizes:
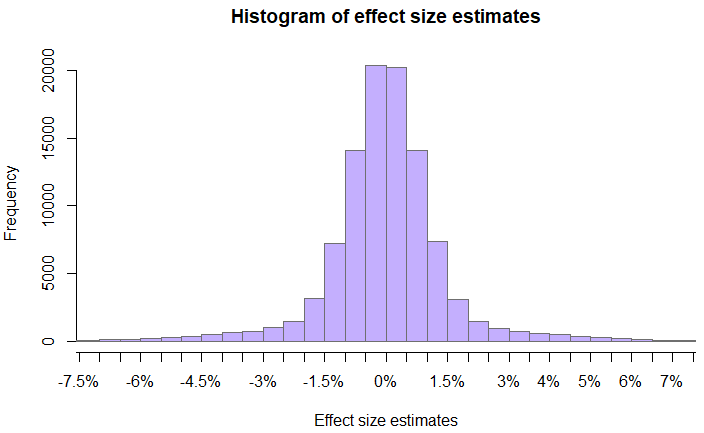
Assume all tests are simple superiority A/B tests with H0: μ ≤ 0 and H1: μ > 0. For simplicity, further assume that all tests share the same fixed sample size and significance threshold. Taking the effect size estimates to be unbiased estimators of the true effect sizes, a way for the parameters of equation (6) to be calculated is by simulating tests from the distribution of effect size estimates.
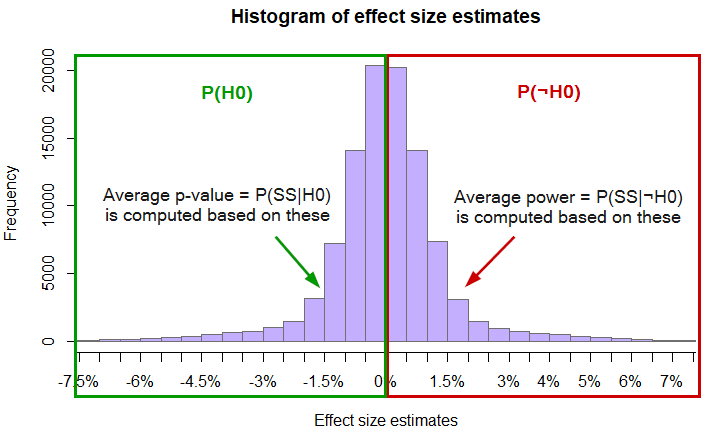
Since the probabilities P(H0) and P(¬H0) sum to one by definition, estimating either is a matter of computing the ratio of probability density above zero to that below and equal to zero. With the given distribution of true effect sizes the median of the distribution is at zero, so P(H0) = P(¬H0) = 0.5.
P(SS | H0) can be estimated by simulating experiments in which random noise is added to a control with a given base effect and to a randomly selected true effect size, then calculating the resulting p-values. At this point P(SS | H0) can be empirically estimated by way of simple division of the number of p-values that fall below the significance threshold α from tests with true effects belonging to H0, by the number of such tests. With 20 million users per test group and α = 0.025 (2.5%), P(SS | H0) can be estimated at 0.004254 or ~0.43% actual type I error rate.
While an estimate of P(SS | ¬H0) can be obtained in a similar fashion by using values outside of H0, a more precise estimate can be obtained by averaging the power against the known true effect size in each test. With the same parameters the simulation results in P(SS | ¬H0) = 0.3516 for an average power of ~35%.
Visually the above can be summarized as such:
Plugging the above values into equation (6) results in the following FPR estimate:
(P(SS | H0) · P(H0)) / (P(SS | H0) · P(H0) + P(SS | ¬H0) · P(¬H0)) = (0.0043 · 0.5) / (0.0043 · 0.5 + 0.3516 · 0.5) = 0.00215 / (0.00215 + 0.1758) = 0.01208
So, in this hypothetical example the estimated false positive risk is approximately 1.21%. The simulation code can be accessed here.
The two-sided case
In the above scenario, if instead of one-sided hypotheses, all tests are of point nulls H0: μ = 0 against H1: μ < 0 OR μ > 0, estimating P(H0) becomes an issue since in a continuous distribution P(μ = 0) is zero, hence FPR always equals zero as well. Defining a tiny range around zero results in a non-zero and typically tiny FPR, without the need to adjust p-value and power calculations and has the additional effect of P(SS | H0) ≅ α.
However, if the range is of any substance adjustments become necessary and the two-sided test is transformed into two one-sided tests. In such a scenario the main factor affecting the resulting FPR is the proportion of true effect sizes covered by the such defined H0‘. The greater that proportion is, the larger P(H0) becomes and hence the larger the estimated FPR.
Issues with current approaches to estimating FPR
It was shown that false positive risk can be reasonably estimated for a set of tests using equation (6). However, the current literature on false discovery risk and Kohavi et al.’s work on false positive risk in particular propose that equation (4) be used to estimate FPR. Major issues exist with putting a sign of equivalence between equations (4) and (6) as discussed below.
Estimating the probability of a false negative
A key input for the false positive risk calculation is P(SS | ¬H0). In equation (4) it is equated to (1 – β) – the power level of the test against a specific effect size.
However, such an equality does not hold since β is the type II error rate evaluated at a particular value under the alternative hypothesis. Denoting such a value by μ1, then β(T(α); μ1) = P(d(X) ≤ c(α); μ = μ1). (1 – β) is therefore exactly the test’s statistical power at said effect size: POW(T(α); μ1) = P(d(X) > c(α); μ = μ1) . The power level at μ1 corresponds to P(SS ; Hμ1), and not P(SS | ¬H0) since ¬H0 is a composite alternative H1 encompassing all possible point alternatives Hμ for which μ belongs to H1. This is why the equality does not hold.
Equating 1 – β to P(SS | ¬H0) is equivalent to treating the power function as uniform over H1 or to assuming that μ1 is the true value of μ or to collapsing H1 to a single value – Hμ; μ = μ1. Neither of the above correspond to the definition and calculation of statistical power.
The false positive risk equation, as proposed, does not correspond to what it claims to calculate, namely the probability that a statistically significant result is a false positive.
As equation (4) does not follow from equation (6) it cannot be claimed to produce an estimate of false positive risk. Estimating P(SS | ¬H0) is a major hurdle in arriving at an FPR estimate. It is somewhat addressable only in the specific case of a set of tests.
Estimating the probability of a false positive
Another component of the formula is P(SS | H0), the false positive rate or type I error rate. In equation (4) it is equated to the test’s significance threshold α. This, however, is only correct in applications of the formula to two-sided tests in which the null hypothesis is strictly applied, but there the false positive risk is zero due to P(H0) = 0. If H0 is instead defined as a tiny interval around the point null to allow P(H0) to be greater than zero, then using α works as an approximate estimate of P(SS | H0). However, the resulting FPR estimates would necessarily be tiny and strongly determined by how wide the interval around the point null is.
In one-sided tests, which are warranted in most A/B tests, α is no longer an estimate of P(SS | H0), as shown in “Estimating the false positive risk of a set of tests”. Instead, an approach similar to estimating the power against the true effect sizes needs to be taken: p-value calculations have to be performed across the whole range of H0 in order to arrive at a mean p-value against it, which is then an estimate of P(SS | H0). As with mean power, this approach only works for sets of tests and further requires that it can be assumed that the observed effects are unbiased estimates of the underlying true effects.
Equating P(SS | H0) with α in equation (4) holds only in cases where the FPR estimate is not interesting by virtue of its tiny value, and does not hold in the typical case of rejecting directional claims since those require one-sided tests.
Estimating the probability of hypotheses
It is impossible to know the most impactful component of both equation (6) and equation (4): P(H0) and hence also the complementary P(¬H0). At the level of a set of A/B tests an estimate of the frequency of true nulls could be arrived at using the estimated effect sizes of said tests. To the extent that it is good, it can be used to estimate the FPR for that particular set of tests, as already shown.
However, the approach currently suggested for arriving at such an estimate is inadequate, resulting, on its own, in erroneous FPR estimates.
Erroneous FPR estimates
The Kohavi et al. 2022 paper presents several FPR estimates ranging from 5.9% to 26.4% which have been used to argue that false positive risk may be much higher than expected:
What Table 2 summarizes is how much more likely it is to have a false positive stat-sig result than what people intuitively think.
It may be interesting to discuss the rigorousness of these estimates in case it turns out there is value to be found in false positive risk as a measure.
The first major issue is that these FPR values are produced using equation (4) which has been shown to not be capable of calculating false positive risk. As already discussed, there are the issues of:
- the wrong equivocation of P(SS | ¬H0) with (1 – β) which is biasing the estimates in an unknown direction.
- equating P(SS | H0) with α in what is described as a directional, a.k.a. one-sided test: “because only statistically significant improvements are considered successful” [1], which, in itself, is biasing FPR estimates upwards.
The combined bias due to these two factors is, however, impossible to estimate since estimating P(SS | ¬H0) and P(SS | H0) for use in equation (6) requires the full distribution of estimated effect sizes and the sample sizes of all tests.
Finally, and crucially, thе wrong type of frequencies are used as estimates of P(H0) and P(¬H0). Instead of frequencies derived from observed effect sizes, “success rate” estimates are presented with values ranging from 8% to 33%.
These “success rates” represent a sample of statistically significant outcomes only, as described in Kohavi, R., Longbotham, R. (2016) [5]. Therefore, the success rates include false positives and exclude all false negatives.
Instead of P(¬H0) these success rates represent something like P(¬H0 | d(X) > c(α), ρ) where ρ is a factor to account for additional information such as the “different accounting schemes” mentioned in the paper with regard to their estimation. Such “success rates” cannot serve as good estimates of P(¬H0) and P(H0) (through P(H0) = 1-P(¬H0)).
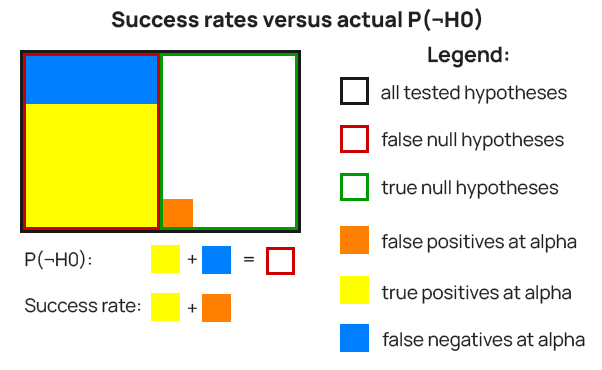
To visualize the above, examine Figure 4. In it, P(H0) is the green border rectangle and P(¬H0) is the red border one. The success rates are supposed to represent P(¬H0) – the red border rectangle, but instead represent the combined area of the yellow fill and orange fill rectangles. The latter has to be removed and the missing blue-filled area has to be added for a true estimate of P(¬H0). The success rate would be a somewhat smaller (or larger) area if ρ is different from one, that is if “different accounting schemes” were used.
The false positive risk estimates presented in the paper are based on the wrong type of estimates for the frequency of true nulls.
It should be noted that false negatives would make up a much larger proportion of the false null hypotheses if the average statistical power against the true effect sizes is lower than the ~80% used in the illustration. This can happen if the distribution of true effect sizes has a lot of its density close to zero, with smaller sample sizes, or a combination of the above.
Azevedo et al. (2019)[7] present a distribution of effect sizes in their Figure 3a which has a median of roughly zero. This coincides with the lift estimates distribution from a meta analysis of 1,001 A/B tests[6] by this author which also has a median of approximately zero. Assuming simple superiority tests this translates to P(H0) ≅ P(¬H0) ≅ 0.5 or about 50%.
Previously discussed issues with equation (4) aside, if the above studies are used as a guide to what P(H0) and P(¬H0) might be in the datasets cited in Kohavi et al. (2022), the use of success rates instead of the correct estimates of P(H0) and P(¬H0) likely results in higher FPR estimates. Unfortunately, whether that is or isn’t the case cannot be determined without effect size estimates and sample size information for these particular sets of tests.
How insightful is the FPR of a set of A/B tests?
For false positive risk to be useful and actionable as a measure of a set of A/B tests, one has to be able to alter the parameters that go into its computation in a meaningful way. Likewise if it is to be one’s goal to achieve a particular FPR value. Discussing the different ways the false positive risk of any set of A/B tests can be altered may further illuminate why that may be difficult and why using a particular FPR as a goal may not be desirable.
Ways to decrease false positive risk
There are several distinct ways to alter the inputs of equation (6) so that a decrease in actual false positive risk is achieved:
- decrease the number of true null hypotheses being tested
- increase the number of false null hypotheses being tested
- test more impactful changes
- decrease the significance threshold
- increase the sample size
- a combination of the above
Here are some of the possible ways to decrease false positive risk, visualized:
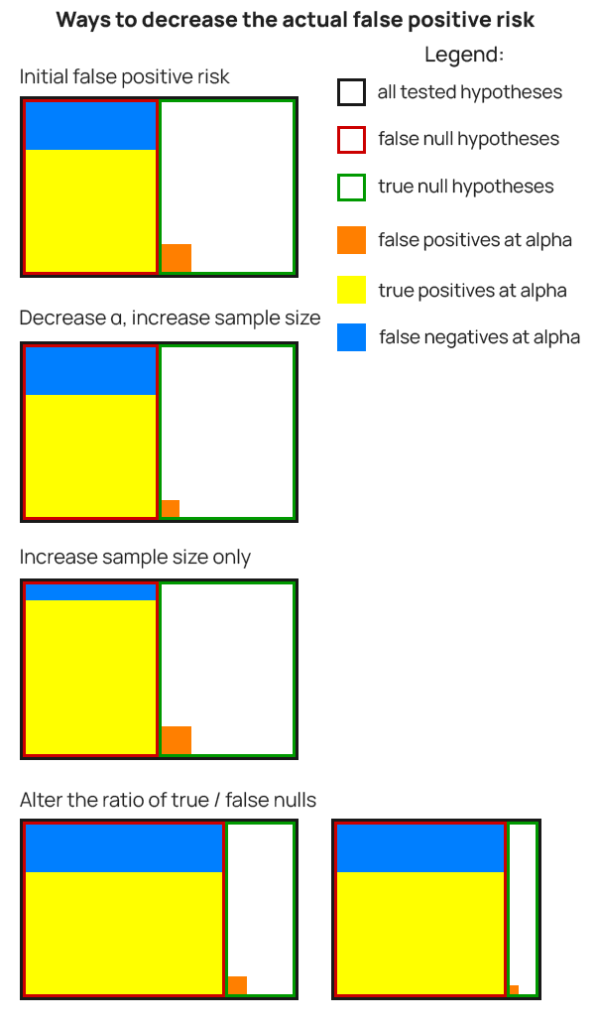
As in Figure 1, the false positive risk is the ratio between the area of the orange rectangle and area of the yellow and orange one combined.
It should be noted that some approaches to #1 and #2 from the bullet list might realistically lead to an increase or decrease of the total number of hypotheses being tested, which would be shrinking the entire set of tested hypotheses. This is the scenario to the right on the last row.
Of all the options, #1 and #2 are the most impactful ways to decrease false positive risk. Achieving either #1 or #2, or both, will result in a lower ratio of true nulls to false nulls, which will lower FPR.
#1 is flat out refusing to test anything risky or to just implement riskier things without any testing whatsoever. Attempting to decrease the number of true nulls means limiting experimentation of hypotheses that are either too mundane or too risky. Such changes are to be either rejected outright, or implemented without testing. One throttles innovation and the other undermines a primary goal of A/B testing in business – to control risk.
#2 translates to testing a greater proportion of previously tested and well-researched interventions. Is FPR needed to know this is desirable, to the extent that such hypotheses are available to choose from? If a practitioner knew better ways to improve a product or business, they would be testing more of those regardless of any concern about false positive risk.
#3 is to widen the range of the distribution of true effect sizes by testing more hypotheses that achieve a larger impact, and it is better if it is a positive one. However, if ways of positively impacting user behavior in a big way were available, these would definitely make it to the front of the testing queue unless there was prohibitive cost in testing and/or implementing them. Therefore, introducing a false positive risk goal or measure will have no effect on how an experimentation program is run.
If a risk/reward framework was used to choose the sample size and significance threshold for optimal balance of risk and reward, then both #4 and #5 above will result in suboptimal risk/reward ratio. If that was not the case, then the outcome can be in either direction, depending on the starting point on the optimality curve.
Using false positive risk to guide the choice of test parameters will hurt any businesses that have already adopted a proper risk/reward framework for determining A/B test design parameters.
In general, smaller organizations acting on #4 and #5 with a goal of lowering FPR will be prone to throttling innovation and slowing down development cycles due to the significantly longer time required to run a test.
For example, if an A/B test takes one month to run with a p-value threshold of 0.1 at the expected rate of users recruited in the experiment (100,000 per week, 2% baseline), with a p-value threshold of 0.01 it would take just over three months while with a threshold of 0.001 it would take about six months to accomplish that. This is just an illustrative example, and not an argument for using any specific threshold since each test should justify its chosen level of significance for taking action.
Given that nimbleness and willingness to take risk that gives competitive advantage to smaller businesses, the decrease in false positive risk by using #4 or #5 above is more likely than not to harm the competitiveness of businesses that attempt it.
When does false positive risk increase?
While ways of decreasing false positive risk might hurt the performance of an experimentation program, increases of the actual false positive risk may also come as result of beneficial changes such as:
- Aligning significance thresholds and sample sizes with risk/reward calculations, depending on relationship to previous practices
- Adhering to meaningful timeframes for running experiments based on both development deadlines and external validity concerns (e.g. due to cookie deletion, etc.)
- Testing a larger proportion of minute changes than before, which are likely to result in tests with low power against the actual effect size, even with non-inferiority tests
These are mirroring the ways to decrease FPR and a different angle to highlight why false positive risk is a poor metric to judge the performance of A/B testing programs.
A lower false positive risk is not necessarily indicative of a better experimentation program, nor vice versa.
The information missed by false positive risk
Another reason why false positive risk fails to be particularly actionable is that it fails to reflect the number and size of both the true and the false test findings. Properly calculated, its input uses estimated effect sizes, but they are not impacting the output the way they could be. In its dichotomous nature, false positive risk fails to incorporate a lot of important information and for this reason the FPR of a set of experiments cannot in itself be used to judge the value they provided to a business.
A much more informative metric would use the estimated effect of each implemented or rejected variant to arrive at an overall evaluation of the performance of an experimentation program. A good candidate is the average marginal improvement in risk-reward ratio versus implementing the same changes without experimenting. In Analytics Toolkit’s A/B testing hub the marginal improvement is computed at the end of the planning phase of an A/B test. Businesses, experimentation leads, and CRO agencies would be better off focusing their efforts on improving the overall value of the program, instead of on false positive risk.
Using FPR instead of the average improvement in risk/reward over non-testing is like using a conversion rate per user when you could be using average revenue per user. It is well known that the latter incorporates the former and also contains information about average order value (AOV). Therefore FPR in itself is not a very interesting measure at the business level, especially when it could be estimated with sufficient accuracy as other measures produce more actionable insights.
SECTION 3: False positive risk in a single A/B test
The third major section discusses false positive risk at the level of an individual A/B test where FPR is proposed as both a measure that guides the design parameters of a test and as a post-test statistic accompanying p-values and other estimates.
At the level of an individual test μt – the true value of μ needs to be known to then calculate P(SS | ¬H0) = POW(T(α); μt) = P(d(X) > c(α); μ = μt). Likewise for P(SS | H0) in a one-sided test (the two-sided FPR is zero or near-zero). The issue is that if μt is known, there is no need to perform an A/B test or to compute any statistics. In a frequentist framework μt is fixed but unknown so calculating P(SS | ¬H0) through POW(T(α); μt) cannot be operationalized. Going full Bayesian one can introduce a full prior distribution of μ and estimate the average power against it, but typically such information is not available and even when it may be said to exist, is subject to issues common to all such approaches. These common issues and problems particular to false positive risk as a test statistic are discussed below.
Using FPR to determine test design parameters
A statistical test design is fully parametrized by its sample size and significance threshold. One suggested use for FPR is to inform the p-value threshold at which a result is deemed statistically significant. E.g. with an aim to get an estimated FPR of 0.05 a significance threshold of 0.001 (99.9% confidence) may be required and/or the sample size may need to be increased to maintain or improve the statistical power level against a chosen minimum effect of interest.
Notably, targeting a given FPR does not provide any guidance on how to balance the two opposing types of error rates – false positives and false negatives since increasing either decreases FPR. A target FPR can be achieved by decreasing either and there is no guidance which one to prefer.
While using FPR to determine test parameters may seem desirable, it is revealed as inferior when compared to an adequate risk/reward approach. One such approach for determining the sample size and significance threshold of A/B tests with an aim of optimal balance of risk and reward has been proposed by the author and implemented in Analytics-toolkit’s A/B testing hub. It estimates an optimal balance between false positive rate and false negative rate, given the information at hand. For more on the topic, see this glossary entry and the related references, or even better – the chapter on optimal thresholds and sample sizes in this author’s book “Statistical Methods in Online A/B Testing” which offers a more complete picture.
The comparison with a more complete approach to balancing risk and reward reveals that FPR when used to choose test design parameters fails to incorporate test-specific information such as business considerations surrounding the test. Namely, costs and benefits during testing and post-decision.
Given the above, false positive risk can not serve as a replacement for a proper risk/reward analysis in determining the optimal significance threshold and sample size of a test.
FPR is not intuitive, nor “what one really wants to know”
Many Bayesian claims revolve around their methods delivering what a practitioner or stakeholder actually wants to know, or their test statistics being more intuitive than alternatives. A form of this is saying that they, unlike others, are “exactly what they sound like”. Some of the arguments for false positive risk are similar, given that the whole paper revolves around the theme of intuitiveness. In particular, the following claim is made:
What Table 2 summarizes is how much more likely it is to have a false positive stat-sig result than what people intuitively think.
Arguing that FPR is a more intuitive measure than p-values should mean it is easier to understand and interpret. Since p-value calculations are just a small part of false positive risk it is near-impossible to imagine how a far more complex encapsulating concept may be simpler and easier to properly grasp than one of its components. The opposite could easily be argued based just on the above.
Furthermore, no evidence is offered as to whether:
- people even have any intuition at all about false positive risk
- what their intuition is exactly
- why having such an intuition is needed or valuable
- or how it could be quantified
An additional argument against the supposed intuitiveness of false positive risk is that its proponents fail to correctly put the concept into practice as shown in “Issues with current approaches to estimating FPR”.
Then there is the jump from a 0.05 significance threshold to 0.05 false positive risk which implies that what users really want from p-values is the false positive risk. While staying shy of being explicit, the conflation of false positive rate and false positive risk seems to be present. Stating that when one calculates a p-value they actually want posterior predictive value is a common claim in arguing for different Bayesian methods and it seems that this is the intended meaning. This interpretation is supported by statements regarding the envisioned use of FPR made separately by Kohavi[4]:
“…interpreting the resulting p-value correctly, meaning use Bayes rule to reverse the p-value to a false positive risk”
The justifications for false positive risk as a statistic to include alongside p-values and in arguing that it is needed to interpret a p-value correctly are no different than the intuitiveness case rebutted in “Bayesian Probability and Nonsensical Bayesian Statistics in A/B Testing” and the “what you really want” case rebutted in “Frequentist vs Bayesian Inference” and referenced publications. For the sake of brevity, these rebuttals won’t be repeated here.
Should statistics of a given test be informed by other tests?
In the case of a single test all components of a false positive risk estimate besides the p-value rely on estimation of unknown and unobservable quantities. They enter into the equation in the form of a prior over the entire parameter space. False positive risk and other Bayesian estimates are presented with sub-decimal accuracy and when placed next to p-values may seem like an equally objective measure. Yet they are far from it.
In an error statistics interpretation, probabilities of hypotheses are not definable. Probabilities attach to testing procedures and the aim is to apply them in a way which results in sufficient error control vis-à-vis the test at hand. These probabilities are objective and the assumptions of their computation are empirically testable.
In a Bayesian framing, either relevant prior information about the particular null hypothesis to inform the probability P(H0) and hence the complementary P(¬H0) is needed, or one should go fully subjective and pull priors out of thin air. In both Bayesian approaches, error control is foregone to a lesser or greater extent.
The more objective Bayesian approach uses historical data from other tests to inform a prior based on a tighter or looser connection between the null hypotheses tested in those tests and the current null hypothesis. In other words, the estimate about a particular test depends on outcomes from other, arguably related A/B tests. This conservative approach results in inherently biased interpretation of the data at hand. For example, if the reference tests exhibit small or nil effects, including them introduces a bias against a true larger effect whereas in the opposite case it introduces bias in favor of a larger true impact than is warranted by the data at hand.
To what extent is it even fair to speak of false positive risk as a measure related to any single test then? Given the huge influence of the prior (that is, the other tests) on an FPR estimate it is better viewed as an expression of someone’s prior experience with a little bit of input from the test at hand, rather than as a test statistic.
The parts of equation (6) which heavily or fully depend on information external to the test are in bold, and P(SS | H0) is the p-value:
(P(SS | H0) · P(H0)) / (P(SS | H0) · P(H0) + P(SS | ¬H0) · P(¬H0))
It is evident that the only test-specific inputs in equation (6) are the p-value and the sample size. Everything else is derived from supposedly similar past tests. Given that the sample size is already accounted for in the p-value, FPR seems to add nothing to the p-value as a test statistic.
False positive risk at the level of an individual test does not add any test-specific information not already contained in the p-value.
This latter point is arguably what makes false positive risk at the level of an individual test a no-go, regardless of any of the other points made already.
Summary & conclusions
False positive risk as a measure at the level of a business, experimentation program, or any set of A/B tests is of questionable utility by itself. Both increases and decreases in FPR can be viewed as positive or negative, depending on other factors. Furthermore, if sufficient information is available to estimate FPR with any accuracy, then said information would be put to better use as input to a proper measure of the overall value of the experiments. A good candidate is the average marginal improvement in risk-reward ratio versus implementing without an experiment. Businesses, experimentation leads, and CRO agencies are better off focusing their efforts in improving the overall value of the program which is not what false positive risk measures.
If false positive risk is to be used to determine how well an experimentation program is doing regardless of the above, the following may happen. First, experimenters may be tempted to limit the number of risky hypotheses being put to the test, stifling innovation and creating a copy-cat world. They may also refuse to test mundane changes with little probability of a positive impact as that will greatly inflate their program’s FPR, even with non-inferiority tests. This will lead to a high proportion of changes being released untested. Second, statistical power will be increased without regard to the balance of risk and reward since what is being chased is not a risk/reward-informed minimum effect of interest, but a very high power level to detect true effect sizes of questionable practical consequence. Experimenters may further be tempted to decrease their statistical significance threshold, but only by so much since it makes achieving higher statistical power harder and is therefore in conflict with the second approach which will result in a higher improvement to FPR in a world of small true effect sizes.
The currently proposed formula for estimating FPR of a set of tests has been shown to not follow from the equation it is supposedly derived from. As result of that, and in combination with the use of an inappropriate estimate of the frequency of true null hypotheses, previously published FPR estimates have been revealed as erroneously calculated, with a likely bias to the upside.
At the level of an individual test, if used to inform test design parameters, namely the choice of sample size and significance threshold, FPR compares unfavorably to a proper risk/reward optimization approach. It lacks the tools to inform the necessary balance of type I and type II errors, and does not incorporate key costs and benefits information regarding the test.
As a post-test statistic the use of FPR introduces highly uncertain and subjective information with at best questionable relevance to the test at hand. It is inappropriate to put it on the same footing as the p-value as it lacks its accuracy and objectivity. Most importantly, as a test statistic it fails to surface any test-specific information which is not already contained in the p-value.
Given all the above, it may be seen as pointless to argue whether false positive risk is intuitive or not. Even so, a strong argument can be made that it is likely significantly less intuitive than the p-value it aims to supplement on grounds of facilitating its interpretation. As for FPR by itself, poll results, when available, will be added to this article to make the picture more complete.
Post scriptum: The broader picture
The above discussion on false positive risk is part of a much broader picture of Bayesian versus frequentist inference. Far from being a philosophical debate detached from practice, it has very real consequences on what experimenters think and do every day in online A/B testing and well beyond it. It is not a coincidence that the first article this author wrote on the topic addresses the “what you need to know” argument from Bayesians. Multiple better and better-worded arguments have been put forth since.
Debates surrounding the replicability of scientific findings or their predictive value are as old as science itself. The proposed uses of false positive risk can be considered a local example regarding the replicability and predictive value of online experiments. The topics of replicability and predictive value are, however, much broader than what is encompassed by either p-values or false positive risk.
The papers cited as inspiring false positive risk include the following discussion of false discovery rates in science:
Wacholder S. et al. (2004), “Assessing the Probability That a Positive Report is False: An Approach for Molecular Epidemiology Studies.” Journal of the National Cancer Institute; doi:10.1093/jnci/djh075.
Ioannidis, J. P. (2005), “Why Most Published Research Findings Are False.” PLoS Medicine 2 (8): e124; doi:10.1371/journal.pmed.0020124
Benjamin D.J. et al. (2017), “Redefine Statistical Significance.” Nature Human Behaviour 2 (1): 6-10; doi:10.1038/s41562-017-0189-z
These and other similar works have been addressed and debunked by many statisticians and philosophers of science. Some notable examples:
Mayo, D.G., Hand, D. (2022), “Statistical significance and its critics: practicing damaging science, or damaging scientific practice?”, Synthese 200, 220; doi:10.1007/s11229-022-03692-0
Mayo, D., Morey, R. D. (2017), “A Poor Prognosis for the Diagnostic Screening Critique of Statistical Tests”
D. Mayo’s response at “Should We Redefine Statistical Significance? A Brains Blog Roundtable”
Spanos, Aris (2010), “Is frequentist testing vulnerable to the base-rate fallacy?” Philosophy of Science 77 (4):565-583; doi:10.1086/656009
Spanos, A. (2013), “Who Should Be Afraid of the Jeffreys-Lindley Paradox?” Philosophy of Science 80 (1):73-93; doi:10.1086/668875
Lakens, D., Adolfi, F.G., Albers, C.J. et al. (2018), “Justify your alpha”. Nature Human Behavior 2, 168–171. doi:10.1038/s41562-018-0311-x
Goodman, S., Greenland S. (2007), “Assessing the unreliability of the medical literature: A response to “Why Most Published Research Findings Are False”” Johns Hopkins University, Department of Biostatistics Working Papers. Working Paper 135, pp. 1–25.
While none of the above contains the words “A/B testing”, they all dismantle the concept of false discovery rates, a.k.a. false positive risk, false findings rate, false positive report probability, and so on in ways both different and similar.
For a more complete account consider the book:
Mayo, D.G., (2018), “Statistical inference as severe testing: How to get beyond the statistics wars.” Cambridge: Cambridge University Press. doi:10.1017/9781107286184
While most of the above deal with the arguments at the abstract level, at the empirical level Ioannidis’ claimed false discovery rates (“most research findings are false”, inverse of the positive predictive value) were recently proven wrong (1, 2) in a more empirical manner.
Acknowledgments:
I want to express my gratitude towards Ronny Kohavi and Alex Deng for a discussion and multiple useful comments on a previous version of this article, as well as assistance with parts of the FPR simulations. They disagree with multiple claims in the article and its conclusions. Special thanks to Lucia van der Brink and Ryan Thomas for their feedback on an earlier version. All errors and inaccuracies that may be found are solely mine.
References:
1 Kohavi, R., Deng, A., Vermeer, L. (2022) “A/B Testing Intuition Busters”, KDD ’22: Proceedings of the 28th ACM SIGKDD Conference on Knowledge Discovery and Data Mining, pp.3168–3177; doi: 10.1145/3534678.3539160
2 Wesseling, T. (2019) “The madness of CRO business case calculations”, online at https://www.linkedin.com/pulse/madness-cro-business-case-calculations-ton-wesseling/ (accessed Mar 06, 2023)
3 Colquhoun, D. (2017) “The reproducibility of research and the misinterpretation of p-values.” Royal Society Open Science (4). doi: 10.1098/rsos.171085.
4 Kohavi, R. (2023) “Ronny Kohavi shares how to accelerate innovation by getting results you can trust” online at https://www.kameleoon.com/en/blog/ronny-kohavi-getting-results-you-trust (accessed Mar 06, 2023)
5 Kohavi, R., Longbotham, R. (2016) “Online Controlled Experiments and A/B Tests” in book: Encyclopedia of Machine Learning and Data Mining
6 Georgiev, G. (2022) “What Can Be Learned From 1,001 A/B Tests?”, online at https://blog.analytics-toolkit.com/2022/what-can-be-learned-from-1001-a-b-tests/ (accessed Mar 07, 2023)
7 Azevedo E.M., Deng A., Olea J.L.M., Rao J., and Weyl E.G. (2019) “A/B Testing with Fat Tails”, Journal of Political Economy (128), 12. doi: 10.1086/710607
About the author

Managing owner of Web Focus and creator of Analytics-toolkit.com, Georgi has over twenty years of experience in online marketing, web analytics, statistics, and design of business experiments for hundreds of websites.
He is the author of the book "Statistical Methods in Online A/B Testing", of white papers on statistical analysis of A/B tests, and has been a speaker at conferences, seminars, and courses. Georgi has been distinguished as a winner in the Data & Analytics category of the 2024 Experimentation Thought Leadership Awards.

