Many adherents of Bayesian methods put forth claims of superiority of Bayesian statistics and inference over the established frequentist approach based mainly on the supposedly intuitive nature of the Bayesian approach. Rational thinking or even human reasoning in general is Bayesian by nature according to some of them. Others argue that proper decision-making is inherently Bayesian and therefore the answers practitioners want to get by studying an intervention through an experiment can only be answered in a Bayesian framework.
Whereas I’ve argued against some of the above in articles like “Bayesian vs Frequentist Inference” and “5 Reasons to Go Bayesian in AB Testing – Debunked”, this article will take the intuitiveness of the Bayesian approach head on. I will show that the Bayesian interpretation of probability is in fact counter-intuitive and will discuss some corollaries that result in nonsensical Bayesian statistics and inferences. The latter are being employed in all Bayesian A/B testing software I’ve seen to date.
What is Bayesian probability?
All Bayesian A/B testing tools report some kind of “probability” or “chance”. The image below shows a collection from nine such publicly available tools and how the result from the Bayesian statistical analysis is phrased.
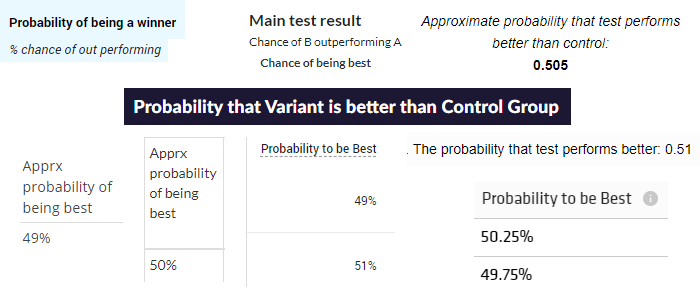
All other tools examined, both free and paid, featured similar language, e.g. “probability of B beating A”, etc.. However, few if any care to offer a technical explanation of what they mean by the term “probability”. In order to keep this piece manageable, I will only refer to documentation of the most prominent example – Google Optimize, which has a market share of between 20% and 40% according to two technology usage trackers. This means it is either the most-used or the second most-used A/B testing software out there.
In the Optimize technical documentation [1] under “What is “probability to be best”?” one sees the cheerful sounding:
Probability to be best tells you which variant is likely to be the best performing overall. It is exactly what it sounds like — no extra interpretation needed!
Apparently “to be the best performing” refers to a future period, so it is a predictive statement rather than a statement about the performance solely during the test duration. This is further clarified in “What is “probability to beat baseline”? Is that the same as confidence?” which reads:
“probability to beat baseline is exactly what it sounds like: the probability that a variant is going to perform better than the original”
The statistic seems fairly straightforward – the number is the probability that a given variant will continue to perform better than the control on the chosen metric if one were to end the test now and implemented it for all users of a website or application*. It is therefore a claim about some kind of uncertainty regarding the true state of the world.
The Optimize explanation, despite its lacking in technical clarity, seems to be in line with mainstream interpretations [2] under which a Bayesian probability is defined as the probability of a hypothesis given some data and a certain prior probability, where ‘probability’ is interpreted as a reasonable expectation, a state of knowledge, or as degrees of belief.
A contradiction in terms
The above definition makes sense superficially. Interpreted in layman terms ‘probability’ is synonymous with several technically very distinct concepts such as ‘probability’, ‘chance’, ‘likelihood’, ‘frequency’, ‘odds’, and might even be confused with ‘possibility’ by some. For some of these distinct concepts the definition can be made sense of.
A closer examination of the definition by using the technical meaning of ‘probability’ in which it is synonymous with ‘frequency’ reveals a contradiction. A hypothesis is, by definition, a hypothetical, therefore not an event, and therefore it cannot be assigned a probability (frequency). It only has possibilities: it could be true or false, or maybe just partially or conditionally true. A probability in the technical sense must necessarily be tied to an event to be definable as the frequency with which it occurs or is expected to occur if given an opportunity.
So, ‘probability of a hypothesis’ is a term without a technical definition which makes it impossible to discuss with any precision. However, this does not seem to be a deterrent to Bayesians.
Does Bayesian probability make intuitive sense?
The issue above does not stop Bayesians as they simply replace the technical definition of ‘probability’ with their own definition in which it reflects an “expectation”, “state of knowledge”, or “degree of belief”. Many proponents of Bayesian statistics do this with the justification that it makes intuitive sense. That claim in itself is usually substantiated by either blurring the line between technical and laymen usage of the term ‘probability’, or by convoluted cognitive science examples which have mostly been shown to not hold or are under severe scrutiny.
Some numbers are available to show that the argument from intuitiveness is very common. There are currently 9,930,000 results in Google Search for [“bayesian” “intuitive”] with most of the top ones arguing in favor of the intuitive nature of Bayesian inference and estimation. In contrast, there are just 356,000 results for [“frequentist” “intuitive”] with most of the top 20 arguing for going Bayesian due to frequentist approaches being counter-intuitive. These are probably representative since adding [-“bayesian”] to the search query reduces the results to a mere 30,500.
It should be noted that the supposedly intuitive nature of Bayesian estimates is the basis on which it is argued that Bayesian statistical results are easier to interpret and are less prone to erroneous interpretations.
Since studies that back up the claim that Bayesian probability is intuitive for its target audience seem lacking, a little quantitative study was in order. I devised a simple poll to determine how intuitive the meaning and usage of Bayesian probability versus the frequentist alternative is among an audience with higher than average proficiency in stats and experimentation.
Quantitative data on the prevalence of competing interpretations of ‘probability’
The poll consisted of asking the following question:
“On day one an A/A test has 1000 users in each test group. A statistical software says there is some ‘probability’ that the variant is better than the control, where ‘probability’ means whatever you intuitively understand it to mean (there is no technical documentation about the statistical machinery). On day ten the same A/A test has 10,000 users in each test group. Given the 10-fold increase in the amount of data, would you expect the probability that the variant is better than the control on day ten to:
A: Increase substantially
B: Decrease substantially
C: Remain roughly the same as on day one”
Option A does not correspond to the expected behavior of a statistic under any framing of ‘probability’. No known good statistic would be expected to show an increased probability with an increase in the sample size of an A/A test. One would expect only a small fraction of respondents to choose this option if they correctly understand Options B and C below so it serves as a measure of the level of possible misinterpretation of the other two options.
Option B is the answer one would expect from someone who considers the hypothesis to be either true or false which corresponds to the frequentist rendering of the problem. They would expect any measure of so-called ‘probability’ to converge to zero with increasing amounts of data since the true ‘probability’ for a variant to be superior to the control in an A/A is exactly zero. This is the behavior of a consistent estimator – one which converges on the true value as the sample size goes to infinity. The reasoning here is that if there is such a probability estimate, it should converge on zero.
Option C is the one which corresponds to what a Bayesian would call posterior probability. Given that all but one A/B testing calculator or testing software use so-called objective priors (uniform distribution, Β(1,1)), the initial Bayesian probability is 50% which corresponds to 1 to 1 odds. With 1,000 users the odds are likely to remain roughly the same as the prior odds. The expected odds with 10,000 users are still 1 to 1 resulting in an expected posterior probability of ~50%.
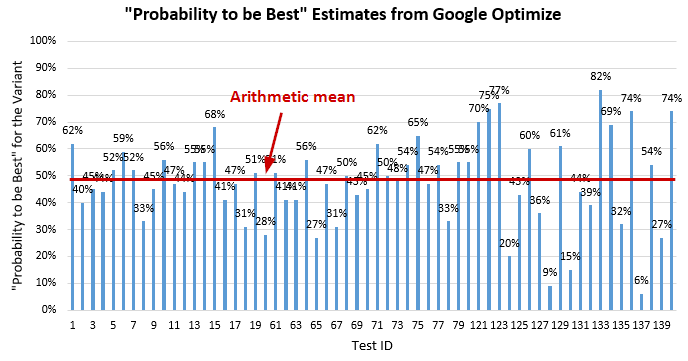
This is also exactly what you would experience if using a Bayesian statistical tool such as Optimize. Even with hundreds of thousand of users per test the outcomes would be centered around 50% “probability to be best” for the variant. The results from 60 real-world A/A tests ran with Optimize on three different websites are shown above. The average of the reported probabilities is 48%. Tests 1-20 and 60-80 had hundreds of thousands of users and their estimates are closer to 50% whereas tests 120-140 had around 10,000 users per arm hence the wider disparity in the outcomes. The same behavior can be replicated in all other Bayesian A/B testing tools.
It should then be obvious that answer C would be chosen as correct under the Bayesian definition of ‘probability’.
The framing of the question does not refer to any particular tool or methodology, and purposefully has no stated probability for day one, as stating a probability might bias the outcome depending on the value. E.g. a probability of 50% on day one might bias respondents to replace ‘probability’ with ‘odds’ in their mind for the context of the poll and such priming would be undesirable given that the meaning of ‘probability’ is the subject of the question. Similarly, an initial value of 1% or 99% might skew results towards the other answers.
The possible answers were presented in random order to each participant through an anonymous Google Forms survey advertised on my LinkedIN, Twitter, and Facebook profiles, as well as on the #measure Slack channel. The following clarifier was added to the announcements: “No answer is ‘right’ or ‘wrong’. I’m simply trying to get an estimate of the intuitive understanding of ‘probability’ in relation to a piece I’m working on.”, except on Twitter (where it got least noticed).
There were also two optional questions serving to qualitatively describe the respondents. The scale for these was from 1 to 10 ranging from “Minimal or no experience” to “I’m an expert”. All 61 respondents also responded to the optional questions for which I am most grateful.
Poll Results
The results from the poll are presented below. First, the self-qualifying questions that describe the respondents’ experience with A/B testing and statistics.
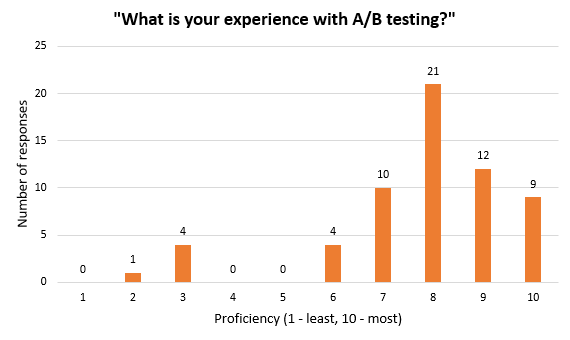

The median is 8 out of 10 for A/B testing proficiency and 7 for statistical proficiency with means slightly below those numbers at 7.77 and 6.43 out of 10, respectively. The qualitative nature of the sample means it is more likely that the respondents have been exposed to Bayesian logic and the Bayes rule itself, or that they have been using Bayesian tools such as Optimize for assessing A/B tests (online controlled experiments). I argue that both of these facts should prejudice the outcome in favor of the Bayesian interpretation of probability.
However, even among such an audience, the results turned out decidedly in favor of the frequentist interpretation in which there is no such thing as a ‘probability of a hypothesis’ as there are only mutually exclusive possibilities.
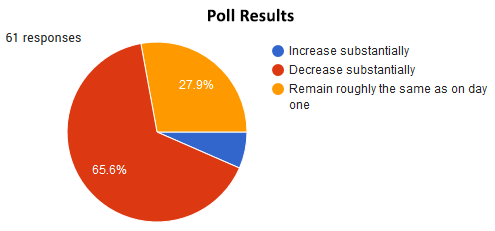
40 participants out of 61 (65.6%, one-sided 95%CI bound is 55.6%) favored an interpretation according to which the probability, however defined, should decline as sample size increases. As explained above, this corresponds to the logic of a frequentist consistent estimator if one presumes an estimator can be constructed for “‘probability’ that the variant is better than the control”. Again, in an A/A test, the true value of such a ‘probability’ would be zero.
Only 17 respondents (27.9%, one-sided 95%CI bound is 37.3%) chose the answer which corresponds to the behavior of an estimate following the Bayesian notion of probability and which would be used in Bayesian statistics.
Just 4 chose the third option, which seems to confirm that the majority of the others understood the question and possible answers as intended.**
Is Bayesian probability intuitive? The verdict.
It is evident that Bayesian probability is not “exactly what it sounds like”, despite the cheerful statements made by Google Optimize and many other supporters of Bayesian methods in online A/B testing and beyond. I argue that if it were so intuitive, the majority of above average users of statistics in an experimental setting would not have had the exact opposite expectation about the outcomes of this hypothetical A/A test.
From the poll results it is evident that the majority of respondents would have been surprised to see that the average “probability to be best” from the 60 A/A tests is not close to zero percent, but to fifty percent instead. They would have been surprised that a 10-fold increase in the amount of data does not nudge the ‘probability’ estimate closer to the true probability and that it is in fact expected to behave in that same way with any amount of data.
The poll results suggest that the Bayesian notion of probability is far from intuitive. Given these data, defendants of the supposed superiority of Bayesian methods on the basis that they are more intuitive and its corollaries need to take a pause.
Odds instead of probability?
Could the Bayesian account based on intuitiveness be salvaged by a slight of a linguist’s hand? Can the ‘probability to be best’ estimator be salvaged in its current form by simply replacing ‘probability’ with ‘odds’? After all, these are in fact posterior odds presented in the interfaces of all of these Bayesian A/B testing calculators, and not probabilities. Perhaps this is the logical way out which would preserve the Bayesian logic and mathematical tooling?
While I think Bayesian estimators can, in general, be saved by using the term ‘odds’ or ‘degrees of belief’ instead of ‘probability’, I think it is difficult to justify these as being ‘objective’ in any sense of the word. In other words, I don’t see them fulfilling the role many proponents ascribe to them. I also do not think any currently available Bayesian A/B testing software does a good job at presenting reasonable odds as its output. Here is my why, briefly.
For posterior odds to make sense, prior odds must make sense first, since the posterior odds are just the product of the prior odds and the likelihood.
Prior odds, however, do not seem to make sense. All but one of the tools I’m aware of use default priors / noninformative priors / minimally informative priors. Namely a uniform distribution, usually Beta(1, 1). This results in prior odds of 1 to 1, 50% / 50%. Do these odds make any sense to you in practice?
The issue with one-to-one odds
One to one prior odds means that one starts from the position that it is just as likely that the current control, which was probably improved over hundreds of iterations, is worse than whatever new version is being proposed as it is that it is better. Wouldn’t it generally be expected to have a much higher probability of being better than the new version proposed?
Are equal prior odds reasonable in all situations (as these tools assume)? In any particular one? Does one really believe, prior to seeing any data, that a +90% lift is just as likely as +150%, +5%, +0.1%, -50%, and -100%, in any test, ever? Because that is what such prior odds imply, and they are applied to all tests. If you think this is unreasonable, then you would think the odds (“probabilities”) presented by these tools generally underestimate the true odds.
On the flip side, if a lot of qualitative and quantitative research was performed to arrive at the new version, is it really just as likely that it is worse than the current version as it is that it is an actual improvement over the control? Odds of 1 to 1 do not seem to make sense here either. In such a case you would also think these tools underestimate the true odds in some cases, and overestimate them in others.
Would any odds do the job?
The important question is: can any prior odds be justified at all, and based on what would one do that in each particular case?
A public safety announcement is due: past performance is not indicative of future performance, as is well known where it shows the most clearly – the financial sector. So there is a big question – to what extent can prior data be used to inform a particular judgement of the data? This does not stop at least one vendor from using informative prior odds based on unknown estimates from past tests on their platform. I leave it for you to decide if that is a good or a bad thing, given that, to my knowledge, these are applied universally across all tests and end users have no control over it.
So it seems the only way to justify any odds is if they reflect personal belief. While this might be acceptable in a scenario of personal decision-making, in a corporate, scientific, or other such setting, these personal beliefs are hardly a good justification for using any specific prior odds. Going in this direction would result in mixing of the highest paid person’s opinion (HiPPO) with the data in producing the posterior odds. I fail to see how this is in any way equal to or better than planning tests and informing decisions using frequentist estimates while keeping them separate from the decision-making process.
Credible intervals to the rescue?
As a final line of defense a Bayesian proponent might point to the intervals produced by the tools and state that they exhibit a behavior which should be intuitive – they get narrower with increasing amounts of data and they tend to center on the true effect which is, indeed, zero percent lift.
However, the issue is that credible intervals (typically highest probability density intervals (HPDI)), coincide with frequentist intervals under conditions encountered in A/B testing. Any apparent advantages of credible intervals over confidence intervals (such as unaccounted for peeking) rest on the notion of the superiority of the Bayesian concept of probability. To the extent that it is based on a supposed advantage in intuitiveness, these do not hold. For other reasons to not use credible intervals see my other posts from the “Frequentist vs Bayesian Inference” series.
It should also be pointed out that unlike frequentist confidence intervals and p-values, Bayesian intervals and Bayesian probability estimates such as Bayes factors may disagree…
Closing thoughts on Bayesian probability
I think the appeal of putting forward the supposed ‘intuitive’ nature of Bayesian probability and Bayesian reasoning stems from the fact that it saves the Bayesians the need to elicit a sensible technical account while also retaining the term ‘probability’. For a Bayesian account to be sensible, it would need to stick to terms like ‘degrees of belief’ or ‘subjective odds’ and stay away from ‘probability’.
Perhaps Bayesians strive so hard to claim the term ‘probability’ through a linguistic trick because they want to break out of decision-making and make it into statistical inference. I think users of statistics would do best to retain the exact meaning of terms and continue applying frequentist and Bayesian methods in the scenarios for which they were designed.
I will end this article with a quote from one of my favorite critiques of Bayesian probabilities. It exposes the non-intuitive nature of posterior probabilities in a brilliant way:
Bear #2: The default posteriors are numerical constructs arrived at by means of conventional computations based on a prior which may in some sense be regarded as either primitive or as selected by a combination of pragmatic considerations and background knowledge, together with mathematical likelihoods given by a stipulated statistical model. The interpretation of the posterior probability will depend on the interpretation of the prior that went into the computation, and the priors are to be construed as conventions for obtaining the default posteriors.
Bear #1: I have had enough please go away now
This was written by Prof. D. Mayo as a rejoinder to a short clip in which proponents of Bayesian methods argued against p-values due to them being counterintuitive and hard to grasp. Turning it around, Mayo’s take is most delightful. I invite you to read it in full.
* It should be noted that whatever “Probability to be Best” actually means, it should not be interpreted as the probability that one will see the improvement observed during the test after implementing the variant.
** As some of those who voted would read this article, I would be happy to hear of cases where one chose a given answer yet would not subscribe to the notion of probability which I assign to it.
References
1 Optimize Help Center > Methodology (and subtopics) [accessed Oct 27, 2020], currently accessible via https://support.google.com/optimize/topic/9127922?hl=en
2 Wikipedia article on “Bayesian probability” [accessed Oct 27, 2020], currently accessible via https://en.wikipedia.org/wiki/Bayesian_probability
About the author

Managing owner of Web Focus and creator of Analytics-toolkit.com, Georgi has over twenty years of experience in online marketing, web analytics, statistics, and design of business experiments for hundreds of websites.
He is the author of the book "Statistical Methods in Online A/B Testing", of white papers on statistical analysis of A/B tests, and has been a speaker at conferences, seminars, and courses. Georgi has been distinguished as a winner in the Data & Analytics category of the 2024 Experimentation Thought Leadership Awards.

