
Sequential statistics are gathering interest and there are more and more questions posed by CROs looking into the matter. For this article I teamed up with Lucia van den Brink, a distinguished CRO consultant who recently started using Analytics Toolkit and integrated frequentist sequential testing into her client workflow. In this short interview she asks questions from the view of a CRO practitioner and their clients and stakeholders. In my answers I draw on my experience as an early advocate for the adoption of sequential statistics, as a developer implementing these methods at Analytics Toolkit, as well as an advisor on the introduction of sequential testing at ABSmartly’s A/B testing platform.
Lucia: What was your reason to create Analytics-Toolkit.com?
Georgi: Initially it was a project aimed at helping Google Analytics professionals automate GA-related tasks at scale, as well as enhance GA data in various ways. My focus, however, soon shifted from web analytics to statistics and in particular – statistical analyses of online A/B tests. As I was noticing significant issues with how statistics were applied in the A/B testing practice, I started to point them out. I wasn’t satisfied with just that as I wanted to also offer solutions to the problems that I covered. For example, after discussing the issue of multiple comparisons where people were incorrectly analyzing A/B/N tests by separate pairwise comparisons (e.g. testing B v A, C v A, and D v A, separately), I added a statistical significance calculator with multiple comparisons adjustments. This allowed users to perform analyses of A/B/N tests with rigorous control of the false positive rate at a time where pretty much no other tool offered it.
Likewise, when I started talking about the issue of peeking on test outcomes with intent to stop a test (a.k.a. “waiting for significance”) and how that inflates the false positive rate, I began work on what is now known as AGILE and shortly after introduced my first implementation of frequentist sequential testing tailored to CROs.
One tool after another, over time the platform shifted towards offering a suite of statistical tools for planning and analysis of A/B tests distinguished by the statistical rigor and the transparency in the methods employed, as well as being designed in a way that minimizes the possibility of misuse and misinterpretation of statistical methods.
Lucia: Can you explain how sequential statistics work ‘for dummies’?
Georgi: It would be my pleasure. In any statistical test, we decide on a level of error we are willing to accept. In frequentist tests this is done through controlling the false positive rate and the false negative rate. Classic statistical tests control these error levels under the key assumption that the data is analyzed just once. How this works is that one determines the test’s sample size or duration up front, then once that sample size or duration is reached a p-value and confidence interval are computed and a decision is made if they meet the desired error level.
These fixed-sample tests, as they are called, are inefficient and impractical as using them means sticking to a predetermined number of exposed users regardless if the performance of the tested variant looks disastrous or super good when examined in the interim. In both of these common scenarios there are strong pressures to stop the test early and call it either way. That is for a good reason since by continuing such a test one could either be losing money or leaving significant money on the table.
Sequential tests are the way to retain rigorous control of false positives and false negatives while allowing you to stop a test early depending on current performance. Since the data is evaluated sequentially as it gathers, the tests are called “sequential”. Error control is maintained by “spreading” the error level across a number of interim analyses. For example, if you perform four weekly analyses of a test with a significance threshold of 0.05 (95% confidence) that 0.05 error will be spread across all four analyses so regardless of when you stop the test it is guaranteed to offer an overall false positive rate of no more than 5%. Likewise for the false negative rate.
Lucia: Do I need to have a minimum number of users in an A/B test to use sequential statistics?
Georgi: Not really. Like any other test you want to have some absolute minimum of a couple dozen users per test variant which is typically not an issue. Anything above that and you are good to use sequential statistics.
As a matter of fact, one thing which makes sequential tests attractive to businesses that only reach a small number of potential customers on a weekly or monthly basis is the ability to stop earlier, on average, compared to a classic fixed-sample test. Typically such businesses also want to iterate fast in order to grow which ties directly with the main appeal of sequential tests.
Lucia: So, you think even a small experimentation program can use sequential statistics?
Georgi: Yes, I think if you’ve found it beneficial to run experiments, even if it is limited to informing a few major decisions per year, you’d find it worthwhile to run these few experiments using sequential statistical models like AGILE.
Lucia: Do you think every CRO practitioner should use sequential statistics?
Georgi: Economies of scale do play a role so it is more economically efficient to employ sequential tests in larger businesses and for more impactful decisions. However, this is also true of experimentation and CRO per se. Once the fixed costs of employing sequential tests are outweighed by the losses avoided or benefits gained by stopping early, sequential testing should be seriously considered. I think this point is reached quickly by most businesses that have found it beneficial to engage in conversion optimization since real-life data shows the average test duration of sequential tests is close to 30% shorter than an equivalent fixed-sample test. This translates nearly directly to monetary gains.
Lucia: What makes sequential statistics so different from other methods like Bayesian and Frequentist?
Georgi: Sequential statistics is not a separate branch of statistics or a separate school of thought. Rather, sequential statistical methods can be employed as part of a frequentist or Bayesian framework. For example, the statistical methods I’ve identified as best-suited for online A/B testing fall within the frequentist approach and offer error control. They are characterized by their ability to control the false positive and false negative rate in a scenario of sequential evaluation of data. Frequentist methods are fundamental to all tools offered in Analytics Toolkit.
Bayesian methods for sequential analysis do not offer such guarantees but instead aim to offer a rudimentary decision-making framework. In practice most if not all of the “Bayesian” tools you can currently find are Bayesian in name only. I’ve covered the frequentist-Bayesian divide and the major issues in how Bayesian methods are currently employed and advertised in a number of articles.
Lucia: Now, I’d like to raise a few practical questions that might help those trying to perform their first sequential test. First off, what are stopping boundaries?
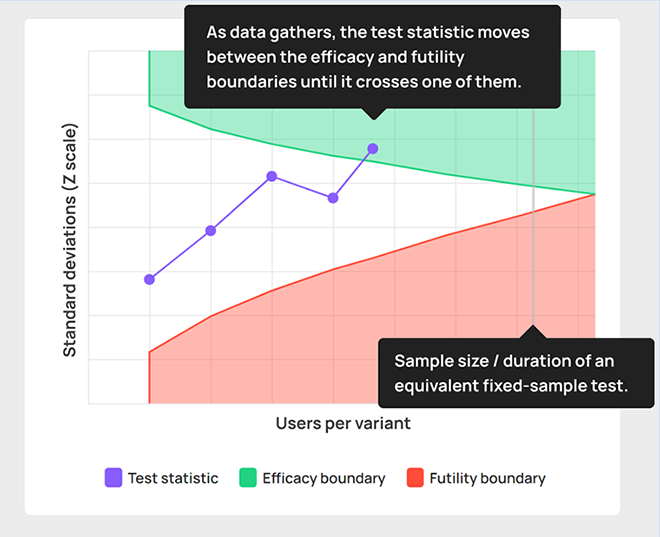
Georgi: The stopping bounds or boundaries are what makes it possible to evaluate A/B testing data sequentially while maintaining error control. If the calculated statistic is above the upper boundary (in green), the outcome is statistically significant according to whatever significance threshold was chosen. When this happens you act in the same way as you would act if a simple fixed-sample test results in a p-value lower than your threshold. Typically this means accepting the variant is performing better than the control and implementing it.
If the calculated statistic falls below the lower stopping boundary, then the test should be stopped for “futility”. This is equivalent to ending up with a statistically non-significant outcome in a classical fixed-sample test. I’d like to mention that in both fixed-sample and sequential tests this can happen even if the observed difference is in favor of the variant. In both cases we act accordingly and declare that there is insufficient information to infer the superiority of the variant over the control.
It should be noted that the boundaries are constructed for each particular test and depend on the number and timing of analyses, as well as the desired error tolerance. For example, with a significance threshold of 0.01 (99% confidence threshold) the upper boundary will be shifted higher compared to the upper boundary of a test with a threshold of 0.10 (90% confidence threshold). Higher values mean it is harder for it to be crossed, thus enforcing the lower error tolerance required. The lower bound is a bit more complicated to compute, but it works in a similar manner to maintain the statistical power of the test.
Lucia: Imagine I’ve stopped my test based on a stopping bound. How do I explain to a stakeholder why I stopped a test earlier?
Georgi: If you’ve stopped early for efficacy, this means the evidential threshold required for the test at hand has been reached. It’s the same as seeing a statistically significant outcome from a fixed-sample test. I would explain that the observed outcome was significantly outside what would have been expected if there was no true effect so it met the error control requirements much earlier. This allows you to implement the improvement for all users earlier while meeting the false positive threshold.
If you’ve stopped for futility, then the test was stopped early due to having a low probability of resulting in a statistically significant outcome if it were to be continued. Cutting the test short in this scenario means reducing the losses from truly worse variants, and reducing the unnecessary exposure of users to different experiences with little chance of being beneficial.
Obviously, the above assumes a simple superiority test, with strong superiority or non-inferiority tests the take-aways need to be adjusted accordingly.
Lucia: What is ‘Efficiency gained’?
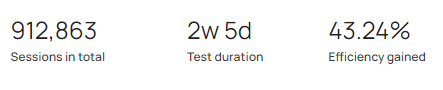
Georgi: This is a measure comparing the sample size required for a fixed-sample test with the same parameters in terms of false positive and false negative error control, with the sample size obtained in that particular instance with a sequential test. For example, if it says you’ve gained 40% efficiency, it means it took 40% fewer users to run the test and that typically means it ended in 40% less time than a fixed-sample test would have required. E.g. if a test was to take 5 weeks to run, if it ended in just 3 weeks that would be 40% efficiency gained.
Lucia: What is the difference between Estimated lift and Observed lift?
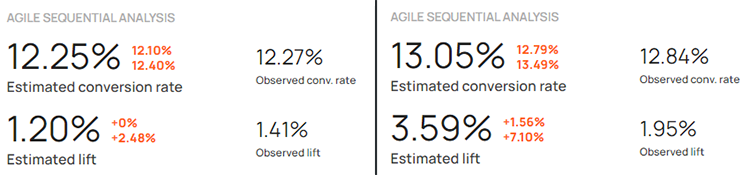
Georgi: A simple way to think of estimated lift is the best guess about the true lift given the available data. With fixed sample size tests the value of the best guess coincides with the observed lift since we only have one random variable to work with – the primary KPI. With sequential tests there is a second random variable – the stopping time, which means the best guess value no longer matches the observed lift. It would differ from it in either a positive or negative direction, depending on each case.
Lucia: Your toolkit uses one Overall Evaluation Metric. Do you also recommend keeping track of one or two guardrail metrics while using sequential?
Georgi: If you’ve got the infrastructure in place, it is advisable to monitor a number of guardrail metrics which by design should be very sensitive to severe deterioration related to a test variant. Due to this, guardrail metrics are often evaluated in near-real time early on in a test using other sequential testing models such as SPRT. While Analytics Toolkit currently does not support such analyses, it is not a far stretch to incorporate them given user interest. This is something you might find in another project I’m involved in: ABSmartly.
This concludes this Q&A. To find out more about Lucia’s work in CRO, see her website and blog at Increase-conversion-rate.com. If interested in learning more about sequential testing you can plan and analyze your first sequential A/B test by signing up for a free trial at Analytics-Toolkit.com. Check out ABSmartly if you are looking for a complete A/B testing solution which includes flexible sequential testing, among a number of other great features.
About the author

Managing owner of Web Focus and creator of Analytics-toolkit.com, Georgi has over twenty years of experience in online marketing, web analytics, statistics, and design of business experiments for hundreds of websites.
He is the author of the book "Statistical Methods in Online A/B Testing", of white papers on statistical analysis of A/B tests, and has been a speaker at conferences, seminars, and courses. Georgi has been distinguished as a winner in the Data & Analytics category of the 2024 Experimentation Thought Leadership Awards.

