
The Mann Whitney U Test (MWU), also known as the Wilcoxon Rank Sum Test and the Mann-Whitney-Wilcoxon Test, continues to be advertised as the go-to test for analyzing non-normally distributed data. In online experimentation it is often touted as the most suitable for analyses of non-binomial metrics with typically non-normal (skewed) distributions such as average revenue per user (ARPU, RPU) or average order value (AOV).
The case for the simple t-test (e.g. Welch’s t-test) being perfectly suitable for analyzing non-binomial A/B testing data has already been made in “Statistical Significance for Non-Binomial Metrics” and the chapter on continuous metrics of “Statistical Methods in Online A/B Testing”. The above cover why the Mann-Whitney U test is completely unnecessary when one is interested in difference in means, even if the underlying data distribution is skewed.
This article explores what happens when the Mann-Whitney U is used to analyze A/B tests for difference in means of the primary metric, regardless of there being no necessity for its use. It aims to show how most of the current use of the MWU in online A/B testing is not just unnecessary and unwarranted, but also harmful.
A/B tests on average revenue per user
In online experimentation, a typical case of encountering a continuous metric of interest is when testing whether a proposed change results in an improvement to Average Revenue Per User (ARPU). The relevant statistical test is that of difference in means (absolute or relative). Its utility is immediately obvious since an improvement in the arithmetic mean translates directly to improvement of business revenue assuming that the tested change has no effect on the number of users. For example, improving average revenue per user by $1 means that for an online business which sees 1 mln users per month it will translate to an improvement of $1 mln in monthly revenue.
If the mean of the control group is denoted by μ0 and that of the test group by μ1, then the relevant statistical test is for μ1 – μ0. The complications introduced by a desire to test for relative difference in means (μ1 – μ0) / μ1 or percent change a.k.a. percentage lift will be left aside for the purpose of simplicity.
The same logic applies to other continuous metrics such as average order value (AOV), average sessions per user, average searches per user, average engagement time per user, and so on and so forth. ARPU will be used throughout the article for the sake of simplicity but the conclusions generalize to all continuous metrics.
What the Mann-Whitney U test actually tests
Having established the problem, it is time to check how good of a fit the MWU test is in addressing it. The Mann-Whitney U test was developed as a test of stochastic difference. In the words of its authors [1]:
“However, in the case considered we are only interested in the alternative hypothesis that measurements in the group receiving treatment are stochastically larger than in the control group.”
Mann, H. B., Whitney, D. R. (1947) “On a test of whether one of two random variables is stochastically larger than the other”
What does “stochastically larger” mean, however? Technically, if f and g are the cumulative distribution functions of the variables in the test and control group respectively, a random variable x is stochastically greater than another variable y if f(a) > g(a) for every a between -∞ and +∞. In probability notation, for y to be stochastically larger than x, the inequality Pr(y > a) > Pr(x > a) must hold for every value of a.
Mathematically, to calculate the U statistic, the values in the test and control group are grouped together, then ordered, and U is calculated as the count of times an observation from the test group supersedes an observation from the control group in the ordered sequence.
Essentially, the MWU compares the rank values of the test group with the rank values of the control group. The more higher-ranked values there are in the test group compared to the control group, the larger U becomes which begets a smaller corresponding p-value. The Wilcoxon rank sum test is practically equivalent.
It is important to note that rank-transformations and hence rank comparisons by their very nature lose information about the magnitude of the difference between values. In other words, the difference between $1 and $2 may be treated the same as the difference between $1 and $10. What this loss of information results in is shown through examples in the section “Consequences of misusing the Mann-Whitney U test”.
Mann-Whitney U as a test of difference in medians
In case both distributions of rank-transformed values can be established to have the same shape, the MWU test can be interpreted as a test of difference in medians. Denoting the median of the control group med0 and that of the test group med1, in this specific scenario the test can be interpreted as a test of difference in medians: med1 – med0.
Does the MWU test fit the problem?
Even if you did not follow everything above to the letter, it should be obvious that the Mann-Whitney U is not an appropriate test when testing whether the ARPU of a test group is larger than that of a control group. All kinds of harmful effects follow from this fundamental mismatch.
As a test of difference in medians
At best, the MWU is a test of med1 – med0 whereas what one is interested in measuring is μ1 – μ0.
Switching from a mean to a median cannot happen without redefining the problem. While a difference in means can easily be translated to an effect on business revenue, a difference in medians cannot be interpreted in the same way. Since the median does not use the full information available in the data, its value can stay the same or become smaller while business revenue improves. Likewise, it can become greater while revenue decreases. This will be shown with examples below, but see “When to Use the Mean, Median or Mode” for more on the topic.
Given that the MWU is proposed for use with decidedly non-normal distributions (due to supposed assumption violations of the t-test), the mean and the median should not be expected to coincide in value, so even the extremely weak argument that a test of medians can be used in place of a test of means of normally-distributed variables has no ground to stand on.
As a test of stochastic difference
As explained above, in a scenario where the shapes of the distributions are different, the Mann-Whitney U tests f(a) > g(a), the stochastic difference. How this relates to a test of μ1 – μ0 depends entirely on the specific shape of the distributions. Some examples are explored below.
Consequences of misusing the Mann-Whitney U test
The MWU can mislead in a variety of ways when used incorrectly for an A/B test which is designed to provide data import for a business question that is answered by a difference in means. These ways are explored with examples below.
Failure to detect genuine lifts
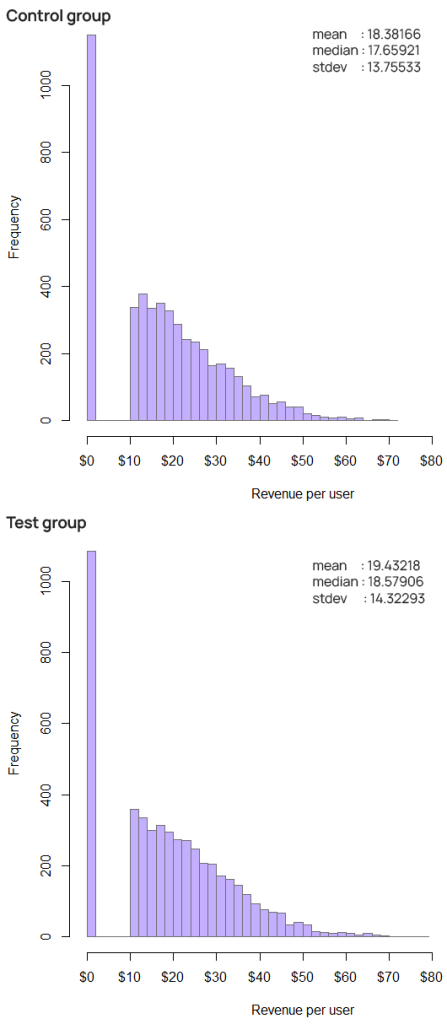
If the shapes of the distribution are different enough such that the median of the control group is greater than the median of the test group, the Mann-Whitney U would sometimes have practically no statistical power to detect even relatively large true differences in the means.
The above graphs and values are from one realization of a simulation with a true mean in the test group of ~20.46 vs ~20.09 for the control, which is a 1.84% true difference, or close to the average true difference one can expect to encounter in A/B tests. In that simulation the t-test showed about 44% statistical power whereas the MWU had a power of 0.6% or practically zero. As expected, both controlled alpha conservatively in the true null case, despite the obvious skewness in the raw data.
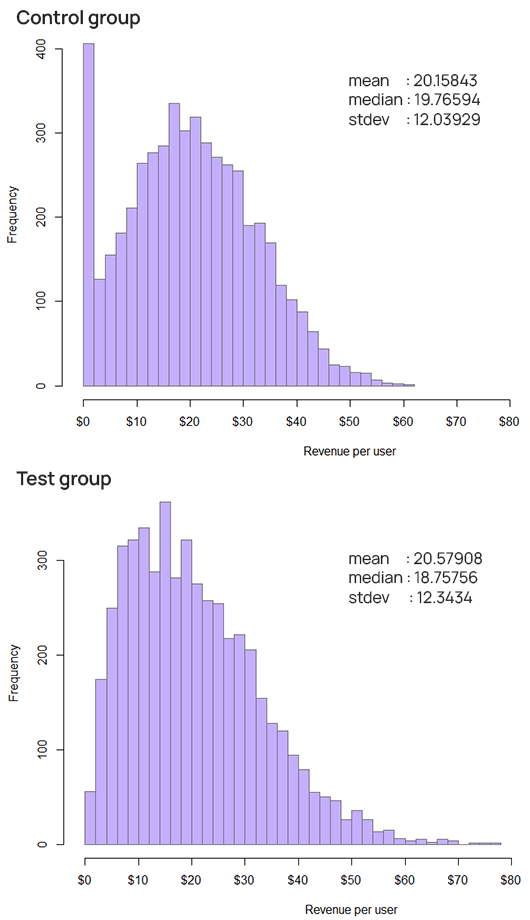
Lower power to detect true lifts
When the shapes of the distributions are essentially the same, the MWU can still suffer from lower power in commonly encountered skewed distributions. The illustrative example below is a single run from a simulation with a true mean in the test group of ~19.29 versus ~18.59 for the control, or a true relative difference of about 3.76%. The medians were 18.53 for the test group and 17.96 for the control.
10,000 simulation runs showed a statistical power of ~80% for the t-test compared to just ~73.3% for the MWU, or a type II error rate of ~20% for the t-test versus 26.6% for MWU. In this example using Mann-Whitney U results in a false negative rate 33% higher than that of the t-test and it would require roughly 20% larger sample size to achieve the power of the t-test. This often translates to a roughly 20% longer test duration.
There are, indeed, scenarios in which a loss of power is justified due to other benefits, i.e. when running sequential tests. However, the possibility of a significant increase in the rate of failure to detect genuine effects and the associated loss of power is not offset by any benefit in this case.
The above is an illustrative example and the actual loss of power will differ depending on the shapes of the distributions in each individual case and the MWU might show power more similar to that of the t-test in other cases. While the prevalence of this low power issue depends on the exact tests one performs, it shows that using MWU inappropriately can come at a significant cost even when its outcome directionally coincides with the outcome of the t-test.
Finding non-existing improvements
While this is almost a purely hypothetical scenario, it is theoretically possible that the skew of the distribution can be opposite in the treatment group compared to the control group, while the mean of the two are the same or the mean of the control group remains higher than that of the test group. In such a case MWU will be signaling statistically significant improvement much more often than a proper test of difference in means such as the t-test as the latter maintains its error guarantees.
In one example simulation with a true difference in means of approximately zero if not slightly negative for the variant, the Mann-Whitney U test detected a statistically significant improvement in ~28% of simulation runs instead of the target 5%. While there is no effect on ARPU and hence total revenue for a given number of users, MWU produces false positives at more than five times the target rate as it detects the stochastic difference in the two distributions, just as it is designed to. The t-test maintained its target alpha conservatively.
Should the Mann-Whitney U test be used in A/B testing?
The Mann-Whitney U test, and the equivalent Wilcoxon rank sum test are inadequate as a test for the business hypotheses experimenters are typically interested in, namely those in which a difference of means is tested. Given that the MWU test is unsuitable for most questions posed in A/B testing one wouldn’t be too wrong in simply saying “Stop Using The Mann-Whitney U Test”.
Abusing the test for situations it was never designed for brings with it the usual harmful outcomes such as wrong inferences, bad estimation, and low statistical power even when a conclusion is directionally correct.
Specifically, misusing and abusing the MWU test may lead to, depending on circumstance:
- failure to detect genuine effects on the metric of interest in some cases (zero statistical power)
- higher rate of failure to detect genuine effects and underestimation of the strength of evidence, even when the decision is right, due to loss of statistical power, leading to more costly tests
- a possibility of detecting an improvement where none is to be found
In the rare case one is interested in a difference in where half of the values lie below or above, the MWU test remains admissible if the sameness of the distributions can be ascertained with sufficient accuracy. It obviously remains a proper test of stochastic difference if that is of particular interest, but a test variant being stochastically better than a control is challenging to translate to business results.
References
1 Mann, H. B., Whitney, D. R. (1947) “On a test of whether one of two random variables is stochastically larger than the other”, Annals of Mathematical Statistics 18, 50–60. doi: 10.1214/aoms/1177730491
About the author

Managing owner of Web Focus and creator of Analytics-toolkit.com, Georgi has over twenty years of experience in online marketing, web analytics, statistics, and design of business experiments for hundreds of websites.
He is the author of the book "Statistical Methods in Online A/B Testing", of white papers on statistical analysis of A/B tests, and has been a speaker at conferences, seminars, and courses. Georgi has been distinguished as a winner in the Data & Analytics category of the 2024 Experimentation Thought Leadership Awards.

