
I’ve already done a detailed breakdown of costs & benefits in A/B testing as well as the risks and rewards and how A/B testing is essentially a risk management solution. In this short installment I’d like to focus on the trade-off between limiting the downside and restricting the upside which is present in all risk management activities, A/B testing included.
Limiting risks also limits potential profits
While in financial circuits it is well understood that hedging your investments against a worst-case scenario comes at a cost, this is sometimes underappreciated in online marketing and conversion rate optimization (CRO) circles. Part of that is due to not having a complete grasp of the fixed and probabilistic costs and benefits. Another reason is the insufficient understanding of statistical concepts such as statistical power.
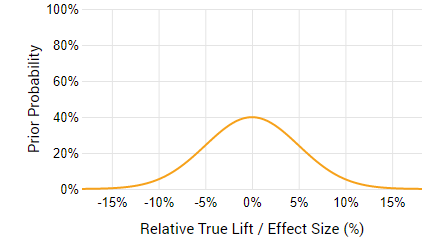
Let us take an example scenario of a company that wants to test a new shopping cart to checkout experience. Let us assume a 3-year exploitation period during which the new experience, if implemented, will stay in place. To restrict the risks and profits only to the performance of the tested solution let us further assume zero cost to test, implement, maintain, or reverse the decision, as well as zero savings. Finally, assume that we have limited prior knowledge about the expected performance of the new experience: we have no prior data that suggest a direction of the effect, but we expect that a change of ±5% to have a high probability and larger improvements or losses to be much less likely. Thus, we have an expectation centered at 0 with a standard deviation of 5% and a scaling factor of 1SD:
If our e-commerce shop is able to push 20,000 users to the shopping cart in a week 50% of which convert and make $1,000,000 in revenue ($50 average revenue per user, ARPU, for the users who make it to the checkout page) then a simple fixed-sample test with optimal risk/reward will last for 2 weeks and have a significance threshold of 96.5% (p < 0.035). I’m not using a ROI-optimal sequential monitoring design in this example only for the sake of simplicity. This is what the risk/reward analysis that we will see using our A/B test ROI calculator (click for full zoom):
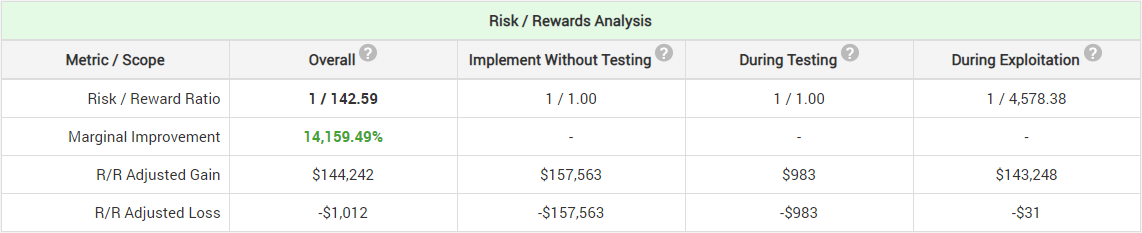
As expected, the risk/reward adjusted loss is limited to only $1,012 compared to the big potential loss of $157,563 from implementing the new experience without testing. Most of those costs are incurred during testing ($983) while only a fraction will be incurred due to an erroneous post-test decision. However, even with no external costs the risk/reward adjusted gain is only $144,242 if we perform an A/B test, compared to $157,563 if we implement without testing at all. We settle for ~8.5% less gain to reduce our risk by 99.36%. Limiting our potential loss also limits our potential gains by the act of employing A/B testing.
While the 8.5% might not look like much of a cost versus the vast reduction of risk, note that this is a scenario favorable to A/B testing. If our online shop was a more niche one or just less well-developed, then we might be getting only 5,000 users per week into our shopping cart while making $250,000 from the 50% who convert ($50 ARPU). Then for optimal risk-reward we need to test for 2 weeks with a 97% significance threshold (p < 0.03). The risk/reward analysis looks like so:
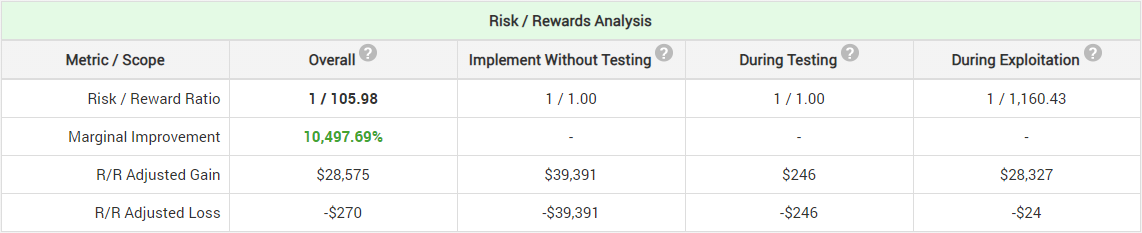
While our risk is reduced by 99.32% our potential gains have been reduced by 27.45%. This is a much more significant price to pay for reducing risk. With 2500 people in the shopping cart per week and $125,000 of weekly revenue the reduction in potential gains is a whopping 42.23%!
Remember that we consider testing, implementation, maintenance, etc. free (unrealistic) and still just by the act of reducing risk through A/B testing we also significantly curb our potential revenue gains. Why does that happen?
Where does the price of risk reduction come from?
In the scenario above the price for reducing risk is incurred due to both:
- Less revenue from delaying the release of a truly better experience to 100% of the users OR less revenue due to testing a truly worse experience (for the duration of the test)
- Little probability to detect small true effects (lack of statistical power for a set of alternative hypotheses).
The reason why e-commerce sites with smaller numbers of customers are paying a higher relative price for a similar reduction of risk is that the balance between 1 & 2 above works out in a less-favorable way leading to a significant reduction in statistical power for the same test duration. For example, if a shop with 5,000 people in the cart per week (example #2 above) wants to achieve similar power in an A/B test, it has to extend its duration 4 times: from 2 to 8 weeks. Then the risk reduction is no longer 99.32% but only 97.55%: risk increases from 0.68% to 2.45%, a 3.7 times increase.
It is important to state again that the above calculations are for an optimal statistical design in which the sample size and thus power is chosen such that it balances with the cost of testing. Increasing test duration further from the optimal will simply mean higher revenue at risk during testing, while decreasing it will result in less power to detect even larger true improvements. The statistical significance threshold is similarly optimal so that it limits exploitation costs appropriately, but not unnecessarily so.
How to reduce or eliminate these A/B testing costs?
As always, we seek ways to reduce or completely eliminate costs. The above trade-off is, however, unavoidable as it is an integral part of A/B tests.
While impossible to completely avoid, employing a sequential monitoring design such as the AGILE A/B testing method would lead to significant reductions in the cost of testing by allowing either faster tests with the same minimum detectable effect and statistical power or detection of true winners of smaller magnitude with the same test duration.
Doing things like “ramping up” tests and sample size rebalancing between groups (both methods of adaptive sequential designs) can also help, but it is proven to be less than or at best about as efficient as the AGILE approach in which the proportion between the test groups is fixed from start to end. At the same time, it makes both the statistical analysis and the test delivery machinery much more complicated. Adaptive designs also worsen the generalizability of the results since different groups could have quite different exposure levels to all factors that threaten generalizability: time-related, population change and novelty/learning effects.
Closing remarks
I believe it is important for business managers and conversion rate optimization practitioners alike to have deep understanding of the trade-off between risk reduction and the limitation of potential gains. The above is just a simple example, but it should have demonstrated clearly that even when one considers all other costs of A/B testing to be zero the risk reduction procedure itself imposes a cost in terms of reduced potential gains.
The above is especially important to for small and mid-sized e-commerce businesses who engage in online controlled experiments. Any small or mid-sized business that relies on testing procedures to limit its exposure to measurable risks should also take note since the price to pay is usually steeper when you have relatively fewer data points to work with.
About the author

Managing owner of Web Focus and creator of Analytics-toolkit.com, Georgi has over twenty years of experience in online marketing, web analytics, statistics, and design of business experiments for hundreds of websites.
He is the author of the book "Statistical Methods in Online A/B Testing", of white papers on statistical analysis of A/B tests, and has been a speaker at conferences, seminars, and courses. Georgi has been distinguished as a winner in the Data & Analytics category of the 2024 Experimentation Thought Leadership Awards.


Hi Georgi,
I am a little bit confused by the assumed prior; assuming a 5% standard deviation and a variance equals to one standard deviation? Some enlightenment would be greatly appreciated!
The notation used conforms to the one implemented originally in our A/B Testing ROI calculator and it is, admittedly, not great. I’ve meant to fix this for a while now, perhaps the time is due. What is referenced by 1SD above is the scaling factor for the normal distribution so one can achieve a flatter (factor > 1) or more erect distribution (factor < 1) at the mean.