What is the goal of A/B testing? How long should I run a test for? Is it better to run many quick tests, or one long one? How do I know when is a good time to stop testing? How do I choose the significance threshold for a test? Is there something special about 95%? Does it make sense to run tests at 50% significance? How about 5%? What is the cost of adding more variants to test?
Have you, like me, asked yourself one or more of the above questions, without reaching a satisfactory answer? If so, then read on.
What is the goal of A/B testing?
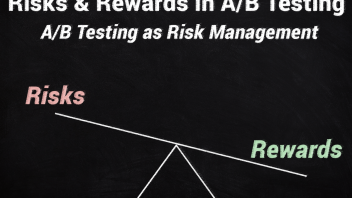
I think we all know what the proximate goal of an A/B test is: to estimate the uncertainty associated with a given data set, helping us make a decision, e.g.: we’ll implement a tested variant if the result from a test is statistically significant. It helps us discern between random noise and the signal for a true improvement (lift, variant better than control). However, the ultimate goal of an A/B test and of an A/B testing process as a series of A/B tests is to provide the best possible balance between taking business risks and reaping business rewards, as measured by that corresponding business’ bottom-line. I argue that A/B testing is by its essence a risk management tool. We aim to limit the amount of risk in making a particular decision, while balancing it with the need to innovate and improve the product or service.
This balance can be expressed either as ROI (Return on Investment), or as a risk-reward ratio.
Business decision-making
In practice, we want our actions to achieve the best possible return on investment which is sometimes mistaken to be equal to generating the best possible improvement in a KPI (Key Performance Indicator), usually expressed as some kind of conversion rate. It is easy to demonstrate why that is not necessarily true with a quick reminder of how ROI is calculated:
| ROI = | Effect * Impact |
| Cost |
With a lift of 2% and impact of $1,000,000 and a cost of $5,000 our ROI is then 0.02 * 1,000,000 / 5,000 = 4 . Usually we express it multiplied by 100 as 400%. The risk-reward ratio in this case would be Cost / Effect * Impact = 1/4, meaning you risk 1 to gain 4. I find the latter easier to understand than ROI numbers (which I then have to switch to ratios in my head) so I’ll be using the risk/reward ratios in this post, but these can be trivially converted to ROI.
It is easy to see that making one huge change may result in a large effect, but if the cost is equally large or larger, it might be a worse decision to make that huge change than, for instance, to make a series of much less costly actions, each having a moderate positive effect. On the contrary, it might not be worth doing something at all, if the expected costs outweigh the expected benefits.
Therefore, before taking any substantial business action, one should ask the following key questions:
- What is the total revenue that could be impacted by whatever I am planning to do?
- What will be the total cost, including fixed and risk-adjusted costs, to take that action?
- What is the expected effect of the action?
Impact is trivial to compute – just estimate the proportion of revenue that will potentially be impacted by the change. But what are the costs and benefits, can we even enumerate them properly? In a previous post I provided a very systematic analysis of the different costs and benefits involved in A/B testing so I ask that you read it if you have not yet done so. Understanding the costs and benefits involved is key for understanding the dance between risk and rewards with regards to A/B testing.
I believe that A/B testing is in a particularly favorable position compared to other cases where statistics are often applied, since we can put a fairly accurate number to a lot of the costs and benefits involved. In fact, much more than almost any other activity I can think of, short of gambling and other similar situations with known odds and easy to enumerate costs and benefits.
A/B testing is fairly unique in that we can get very accurate estimates of the costs and benefits involved.
We can, in fact, estimate how much A/B testing contributes to improving the risk/reward ratio for a given action, compared to taking the action without A/B testing. That is, we can estimate the marginal utility of A/B testing, getting a more or less definitive answer to questions like: should we test this, or release to production right now, are we testing for too long, exposing ourselves to risks during testing, or are we testing too quickly, stifling innovation and progress? Questions like: how much is A/B testing really worth?
Given that, I think there is no excuse for anyone doing A/B testing for any kind of important decision to not calculate both the risk-reward ratio they are looking at, given a set of test parameters, as well as the marginal improvement in that ratio compared to releasing the proposed variant to production without testing. Of course, this should happen during the planning phase of an A/B test. This applies to tests in conversion rate optimization, landing page optimization, e-mail marketing optimization, etc.
Parameters to optimize for best risk/reward ratio
Now that we know A/B testing is about managing business risk, how can we tweak our A/B testing designs in order to get an optimal ratio between risk and reward, between being too brash and too conservative in our decisions?
As already discussed, statistical significance limits the risk of post-implementation losses, while statistical power limits the potential post-implementation gains. Increasing any of the two increases the potential losses during testing. The parameters we can set when designing a statistical test are: the significance threshold and the sample size. The sample size will be determined by the expected amount of users/sessions/pageviews, etc. that will be eligible for the test in a given time-frame. In this sense, test duration and sample size are one and the same. Statistical power can then be estimated based on the minimum detectable effect of interest and the baseline of the primary KPI.
Therefore, it seems like a straightforward task: we pick a minimum detectable effect of interest and then tweak the significance threshold and the duration of the test. However, the issue is that in A/B testing the ratio between the potential risk during testing and the potential risk after implementation is actually quite large. That is, unlike many other cases where the testing costs are negligible when compared to the expected costs of making a bad call, in many practical A/B testing scenarios we may have a test run for 1 or 2 months and the effect of the test only persist for a year or two, before it is either replaced by a redesign, or is tested again (against a new variant). Even when an implementation is expected to persist for 5-6 years, the ratio is nowhere near that in fundamental or applied science, from where the statistical framework originates.
The result from that is that the minimum detectable effect of interest can shift significantly depending on the duration of the test. Therefore, we have a feedback loop, wherein the minimum detectable effect is used to calculate the desired duration of the test, and the desired duration of the test also influences the minimum detectable effect of interest.
To further complicate things, opting for a sequential monitoring scheme like that of the AGILE sequential testing approach makes the duration of the test a variable, not a fixed constant, making it harder to compute the costs and benefits during testing. Testing more than one variant against a control adds complexity as well, due to changes in the ratio of test traffic exposed to the control and variants.
Finally, we may opt for a different null hypothesis than the default one-sided hypothesis of the control being worse than or equal to the control (μ ≤ 0), by throwing in non-inferiority tests (μ ≤ -m) or strong superiority (μ ≤ m) tests in the mix.
Therefore, the main parameters we can change to achieve better risk-reward ratio, and thus a better marginal utility from an A/B test are:
- The statistical significance threshold
- The duration of the test (sample size)
- The monitoring scheme of the test
- The number of variants tested
- The null hypothesis
I’ve also made the case that choosing a different primary KPI can have a positive impact in some situations since it changes the baseline, but let’s not go into such details for the sake of brevity.
Finally, of course, we can improve our risk-reward ratio by testing options with better prior odds for success, which has an interesting effect on the marginal utility of A/B testing that we’ll explore below.
A/B Testing ROI Calculator
With the number of parameters that we can optimize and the intricate relationship between them, including recursive interactions wherein two or more parameters are interdependent, it was obvious that in order to get anywhere near to answering the questions posed in the beginning of this article I should develop a calculator which takes all parameters, combines them with the probability distribution for the expected change in the primary KPI, and produces as output a set of estimates, such as overall risk/reward ratio, marginal improvement of the risk/reward ratio, maximum risk-adjusted loss and maximum risk-adjusted gain, as well as some other relevant data. It would also be great if it could suggest values for at least some of the parameters (sample size and significance threshold) at which one can achieve the optimal possible risk/reward ratio.
And that I did, and so I present the first of its kind A/B Testing ROI Calculator (limited free trial available). All the examples and graphs you see below are from the output of the calculator. The graphs are interactive in the tool itself, but here you will see just still screenshots.
See this in action
Plan your A/B tests for optimal balance of risk & reward.
Testing with 50% Significance (A/B Testing Riddle)
Let’s say we are testing something brand new and we have 4 weeks to test it and our site gets ~18,000 users per week. We don’t know how it will perform so we decide that a prior distribution centered on 0 (zero difference between control and variant) with a modest standard deviation of 4% and the variance of a standard normal distribution is appropriate. Thus, 50% of the prior distribution lies below 0 and 50% lies above zero, and it is exactly mirrored on both sides. If we run a test with a one-sided null hypothesis of μ ≤ 0, with a significance threshold set at 50%, what do you think would the post-implementation risk/reward ratio be, if the test results in a statistically significant winner at exactly 50% observed significance (p-value 0.5)? Basically, what is the ratio between risk and reward if we implement based on a 50% significant result? Assume zero cost for testing and other externalities and a fixed-sample size design for the sake of simplicity.
Take a minute to think about it, then write your answer down. No peeking.
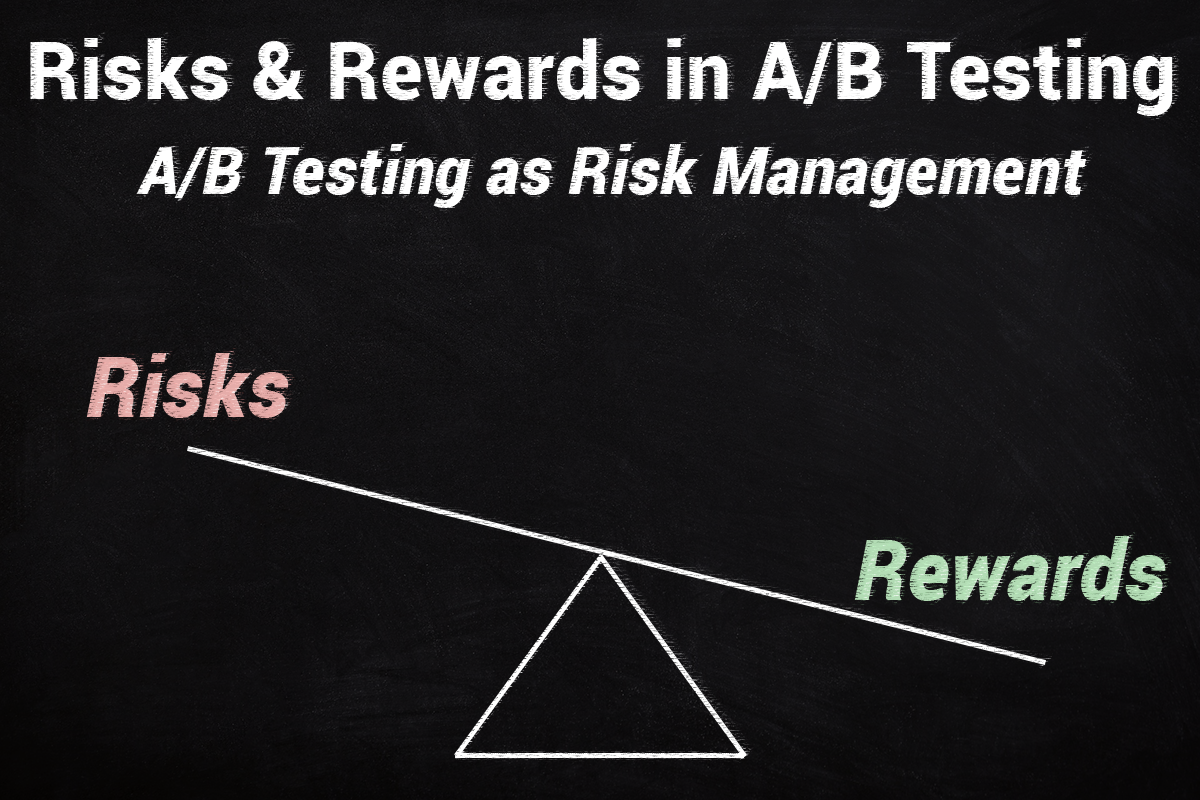
If you wrote it’s 50/50, or 1/1, then you are in for a surprise. It’s nowhere near that, in fact the ratio is 1 / 14.91! Below is the result from the calculator – look at the “During Exploitation” number: risk/reward ratio of 1 / 14.91. Far, far better than 1/1.
 (click for full size)
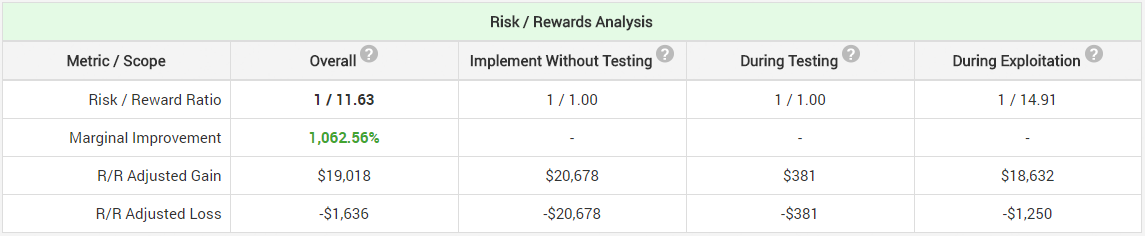
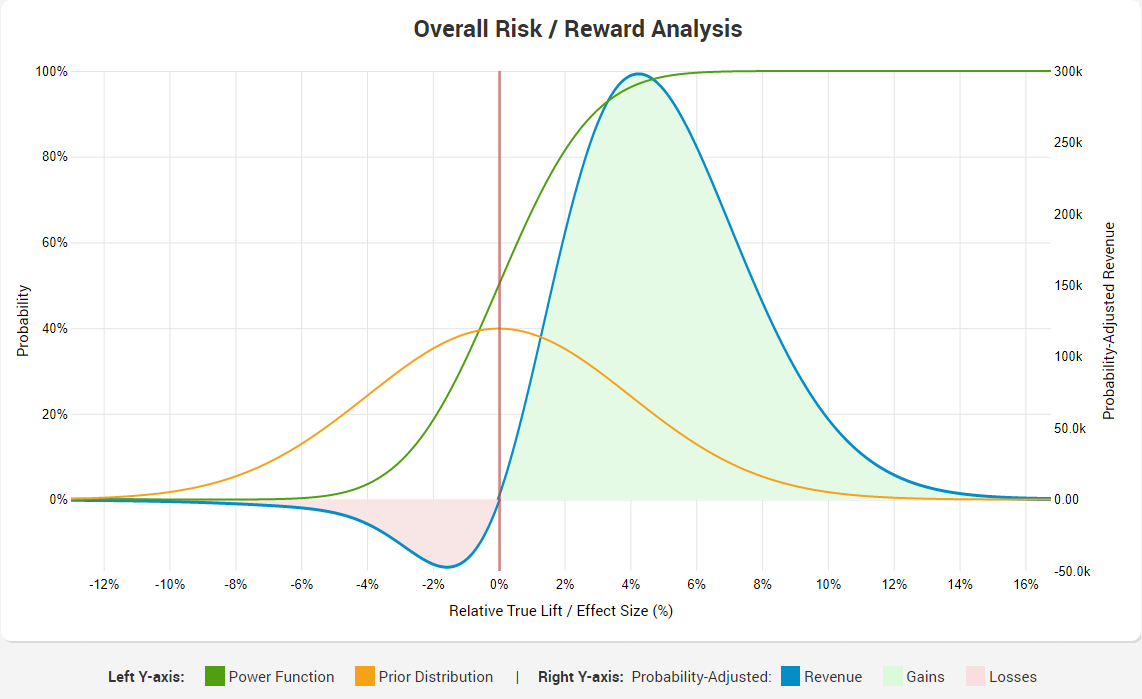
Note that the ratio is 1/1 if you implement without A/B testing, and it is 1/1 during testing, correctly reflecting our prior ambivalence with regards to the direction of the result. Even so, we get a result which is probably startling to many. If it is, it is likely due to insufficient understanding of how statistical power works, and most importantly – that it is not a fixed value, uniform for all possible lifts, but it is a function that rapidly diminishes the worse the result is. This graph will either illuminate you on the issue, or cause you to close this browser tab:
 (click for full size)
The areas represent the overall risk-adjusted gains and losses, while the blue line traces probability-adjusted revenue at each possible value for relative lift percentage. Note the green curve, showing the power function, which is the reason for the high risk-reward ratio. The ratio of 1/14.91 is due to the fact that statistical power drops to nearly zero at around -8% lift, but it grows steadily as the lift reaches positive territory, approaching 100% at around +8% lift and keeping that level for any value greater than +8%.
Here is how the overall risk/reward analysis graph looks like:
 (click for full size)
As you can see, it almost mirrors the exploitation one, with the difference coming from the testing period only (since zero external costs/benefits are assumed in this case).
Does this mean it’s better to test at 50% than, say 95%, in this case? Not really. The calculator actually suggests a test duration of 1 week with a significance level of 97.5% in order to get the optimal riks/reward ratio (1/30.05, compared to 1/11.63), since it also takes into account the cost during testing. Extrapolating this to cases other than the described would also be inaccurate, since changing the prior distribution and the other parameters will result in a higher or lower risk/reward ratio. However, tweaking the parameters to get to the intuitively predicted 1/1 ratio would be a lot of work.
If you were to run the same test at 5% significance threshold, then the post-implementation risk-reward ratio is 1/2.77, still way higher than 1/1.
How long to test for an optimal risk/reward?
The answer here would depend significantly on two things: the prior expectation, and the monitoring scheme used, and since every A/B test is different there is no straightforward answer that applies across the board. We can talk about the general rules though.
If using fixed sample size procedures, then increasing the duration of test while increasing its power at smaller true lifts also increases the risk of prolonged exposure of a part of the users to inferior version(s). If the prior expectation is centered on a positive value, then this effect is smaller, but if you are uncertain (centered at zero or worse) or expect a larger range of results, then running tests for periods longer than several weeks can be very costly.
If using sequential testing methods, e.g. the AGILE statistical method, then increasing the duration of the test has the positive effect of increasing the power of the test, thus its ability to detect smaller and smaller true lifts while also limiting the exposure of users to tests that have little chance to result in a winner. The latter is done through futility stopping rules. Due to efficacy stopping rules which result in bigger winners being detected earlier, tests with sequential monitoring almost universally result in improvements to overall ROI. A sequential test planned for 20 weeks can easily end on the second week, if the results are strongly positive or strongly negative where strong is relative to the minimum detectable effect the test was powered for. The resulting improvement to overall risk/reward varies, but relative improvements of 50-100% were common with realistic scenarios we tested the calculator with.
 (click for full size)
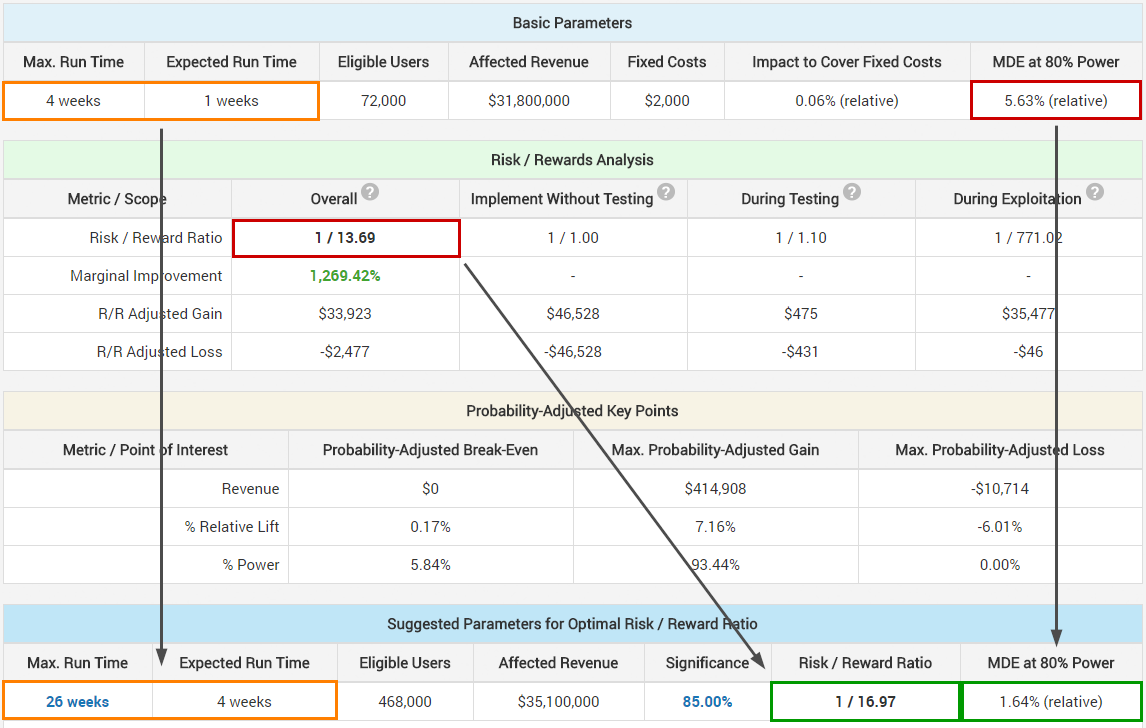
The above is just one scenario in which due to sequential testing the maximum run time of the test is recommended to be set at 26 weeks to achieve the optimal risk/reward ratio. (The comparison above is between two sets of sequential tests, not between a fixed-sample size test and a sequential test.) The change in minimum detectable effect (MDE) is visible and is one of the reasons for the improvement of overall risk/reward. Whether one is happy to commit to potentially testing 4 to 6.5 times longer to improve their risk/reward ratio by 24% or not is, of course, a question that might have a different answer in each separate case.
See this in action
The all-in-one A/B testing statistics solution
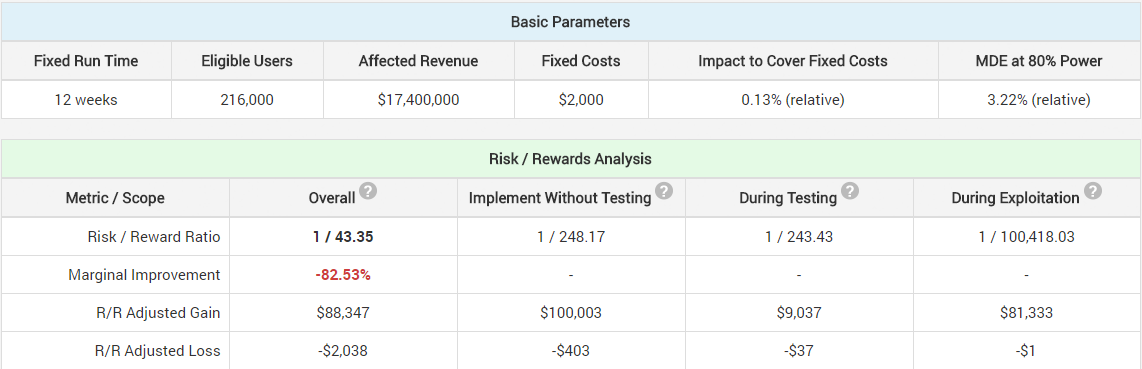
Testing with more variants?
Assuming the same sample size / duration, adding more variants to test reduces the power of the test due to the adjustments to the effective significance threshold to preserve the same nominal one. This means that we are more likely to miss a true positive of smaller magnitude, resulting in worse probability-adjusted gains. However, adding more variants increases gains during testing. For example, adding 2 additional variants and keeping everything else the same, the risk/reward ratio during testing jumps from 1/1 to 1/3. The overall risk-reward ratio in this case goes down by about 5%, even though the MDE at 80% jumps from 5.63% relative lift to 7.19% relative lift.
The effect might be much higher, if the prior expectation for the lift is not centered on zero.
What makes it harder to generalize, is that there are too many moving parts: e.g. adjusting the duration of the test effect post implementation might result in the opposite effect, and so can a violation of the assumption that all tested variants have roughly the same prior distribution (computing without this assumption is possible, but not currently supported).
Are there A/B tests not worth doing?
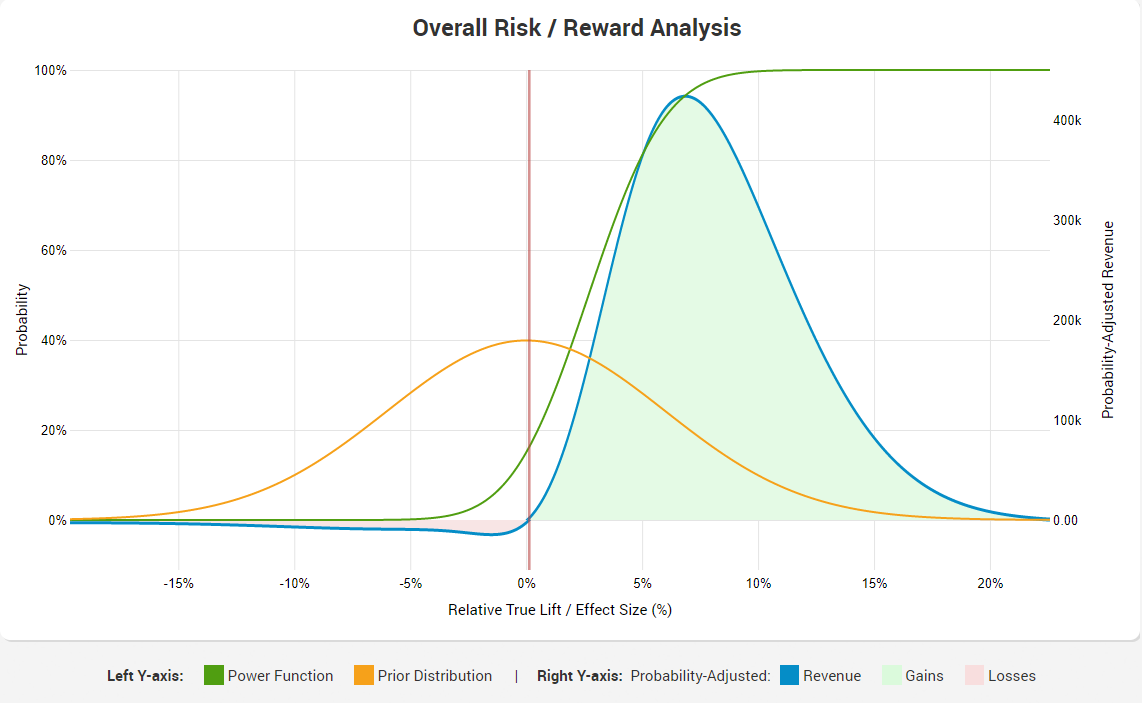
Absolutely. If you are already very certain that the experience you are about to test will outperform the control, then testing becomes an unnecessary overhead: both by the fixed costs it incurs, and due to the risk-adjusted losses by delaying the implementation of the better experience. Here is an example of how that looks as a marginal improvement in the risk/reward ratio:
 (click for full size)
The expectation is centered around 10% lift, 5% standard deviation of the expectation. Even employing sequential testing barely moves the risk/reward needle.
Obviously, the certainty required to reach a point wherein an A/B test will have a negative marginal improvement are rare and very likely would never even reach the CRO team as they will be implemented straight away. However, it should be noted that in most cases an A/B test will have a worse risk/reward adjusted gain than implementing straight away, due to the overhead involved in testing and type II errors (often called false negatives). I think most businesses won’t be tempted to implement directly given a reasonable A/B testing overhead and a marginal improvement of the risk vs. reward ratio that justifies the investment.
The perfect A/B test parameters
This is what an optimal test looks like according to the A/B testing ROI calculator:
 (click for full size)
Of course, this is under parameters for just that particular test. There is no universal recipe for the best test parameters to use in terms of the 5 main ones that reflect onto ROI. However, if in the hands of an experienced A/B tester, who is apt at expressing his prior experience and expertise in the form of a distribution for the expected values (that would be accepted by others), I believe the calculator thus presented is able to come reasonably close to providing you with test parameters that are optimal for the particular test. The tool does not try to automatically optimize the number of variants tested, as this decision would require too many assumptions, nor does it try to suggest an alternative null hypothesis (though this is more straightforward and may be implemented in the future). A sequential monitoring scheme should be preferred in nearly all cases.
Naturally, any estimation of such parameters would be only as good as the input parameters. If you grossly underestimate, or overestimate the fixed costs, or the costs to reverse a decision, the results will be that much off. If you are overconfident in your experience and expertise, or in how well it applies to the case at hand, this will result in a prior that is way off and thus, the calculated ratios and suggestions will be garbage. It is also presupposed that the reader is familiar with the fact that no model is a prefect representation of reality, but, as the quote by George Box goes, “some models are useful”.
I think it would be great if we see more business people make better-informed decisions about A/B testing. I think it would be awesome to see more CRO, LRO and e-mail marketing specialists take a case-by-case approach in deciding what parameters to use for any given A/B test with an eye on the overall risk/reward in terms of the business bottom-line. I’d be happy if the calculator presented above and the logic behind it can get us closer to that kind of world. If you find this post helpful, please, share as you see fit!
About the author

Managing owner of Web Focus and creator of Analytics-toolkit.com, Georgi has over twenty years of experience in online marketing, web analytics, statistics, and design of business experiments for hundreds of websites.
He is the author of the book "Statistical Methods in Online A/B Testing", of white papers on statistical analysis of A/B tests, and has been a speaker at conferences, seminars, and courses. Georgi has been distinguished as a winner in the Data & Analytics category of the 2024 Experimentation Thought Leadership Awards.

