
This is a comprehensive guide to the different types of costs and benefits, risks and rewards related to A/B testing. Understanding them in detail should be valuable to A/B testers and businesses considering whether to engage in A/B testing or not, what to A/B test and what not to test, etc. As far as I am aware, this is the first attempt to systematically review all the different factors contributing to the return on investment from the process of A/B testing. Here I will cover A/B testing mainly as it relates to conversion rate optimization and landing page optimization. E-mail marketing is a bit different, but the general framework should still apply.
Costs & Benefits of A/B Testing on a Timeline
The first thing we should note is that there are three time periods in which one can incur costs and realize benefits:
- before the A/B test (planning)
- during the A/B test (execution)
- after completing the A/B test (implementation, exploitation)
Let’s first take a look at the costs along that timeline:
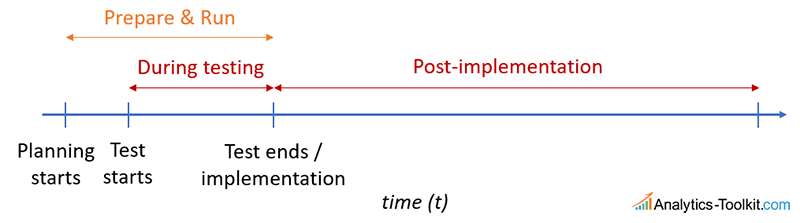
So, we have a number of more or less fixed-costs involved in preparing and running an A/B test. They mostly occur in the pre-test and during testing stage. Then we have the possible cost of running a test with an inferior variant. While doing that, we are losing money, depending on the percentage of users exposed to the tested variant or variants. Usually the more variants we test, the higher this cost would be, since they would be shown to a larger percentage of our users. Another type of cost is the missed opportunity to implement an obvious winner, due to prolonged testing. The quicker we are able to identify a true winner, the lower this cost is.
Finally, after implementation we have two types of costs. One is the obvious cost of implementing a variant which is not better than the control, thus losing money for the duration in which it stays implemented – usually until a redesign, or another test on the same page element or website process. The other is the often-neglected opportunity cost of failing to detect a true winner of a given magnitude, and continuing with the control.
The costs of preparation is not really controlled statistically. The cost during testing can be optimized by efficient sequential testing procedures such as AGILE Sequential Testing that detect both winners and losers of relatively large magnitude much faster than traditional fixed-sample tests. (Other approaches to minimize costs during testing include Adaptive Allocation schemes, multi-armed bandits, etc. but they have their issues and in general don’t perform better than AGILE and similar approaches). You should realize that the cost of implementing a loser is controlled by the statistical significance of the test, while the cost of failing to detect a true winner of a given magnitude is controlled by statistical power.
Speaking of winners, let’s examine the benefits timeline:
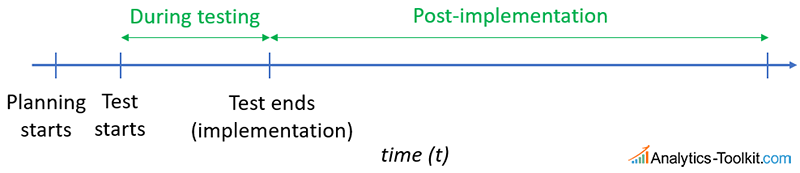
We can’t incur benefits while planning the test. During test, we may potentially benefit from testing a variant which is superior than the control. The more variants we test, the more we benefit during the testing phase, as usually this means a reduction in the percentage of traffic experiencing the control. After the test, we can only benefit if we correctly identify and implement a winning variant. Thus, it is crucial that we have powered our test in a way that we are able to reliably detect lifts that would have a positive impact on the business bottom-line. At the same time, we wouldn’t want to prolong tests too much…
There is also another kind of benefits following the implementation of a test variant. Often the tested variant will have some external benefits, meaning benefits outside of any lift achieved. For example, a variant might be better-aligned with the company branding and overall style and tone. It might be preferred due to subjective visual appeal. It might be that the tested variant, if implemented, would result in savings in terms of operational costs, such as software and hardware costs, support costs, costs in taking product photos or videos, etc. These need to be accounted for as well, and when such are present, non-inferiority tests should certainly be considered.
Thus, it is obvious that, if sample size / test duration is negotiable during the planning stage, as it usually is in A/B testing:
Statistical significance limits the risk of post-implementation losses, while statistical power limits the potential post-implementation gains. Increasing any of the two increases the potential losses during testing.
We end up having to make a trade-off. To better understand that trade-off, let’s look at the different types of costs in gains in another aspect: whether they depend on the true performance of our tested variant, or not.
Fixed and risk-adjusted costs & gains
Obviously, there are fundamentally two types of costs and benefits one should consider. The first are fixed costs related to testing, which are incurred regardless of the outcome of the test, just by virtue of testing. The second are costs that depend on some probability, so they might or might not materialize in any particular case. These I call risk-adjusted costs, or probability-adjusted costs.
There are two types of costs in A/B testing: fixed and probability-adjusted (risk-adjusted).
Fixed costs include things like: cost of testing software, cost of analytical software, hours spent in meetings discussing the test, man-hours for an A/B testing or UX specialist (or both, or a team of such people), designing test variants, developing (front-end and/or back-end) of the test variant(s), quality assurance of the test variant(s), man-hours to analyze the results and prepare reports. All of these would be incurred if you decide to test, regardless of the outcome. For trivial tests these might be a couple of hundred dollars, but usually they would be in the thousands range, reaching tens of thousands for complex and involved tests.
I don’t think there are fixed benefits, that is: benefits that will be enjoyed regardless of the outcome of the test. If there are, why test and not get the benefit straight away?
Risk-adjusted costs include any cost that depends on the actual performance of the tested variant(s). It is, at the time of planning the test, unknown, however, experience and common sense can be used to define a reasonable probability distribution that describes, more or less, your informed expectations about the true performance. It is no doubt that such a distribution is bound to be subjective. I will readily agree, as well, that there is no straightforward process of converting one’s common-sense, know-how and professional experience into a probability distribution. However, what is the alternative, if one wants to estimate the business costs and benefits of an activity, when some of these are not fixed?
If the alternative is to go with the intuitive assumption to represent lack of information with a uniform distribution, then it is just as bad, since it is no less subjective to plan a test with the implicit intuitive assumption that all outcomes are equally likely. Saying that the improvement (lift) from a tested variant is as likely to be 2% as it is to be 50% and -50% is just as subjective, since you have no data to back up such an assumption. The assumption that they are all equally likely is actually a very strong subjective assumption.
Assuming all outcomes from a test are equally likely is a strong subjective assumption that is rarely, if ever, warranted.
Prior probability distribution of the expected outcome
In order to calculate a risk-adjusted cost, or gain, you define a range of expectations, with different probability densities at different points. Usually these points would be expressed in terms of relative lift, or relative improvement in whatever primary KPI you are using: average transactions or goal completions per user, average revenue per user, average pages per session or average session duration, etc.
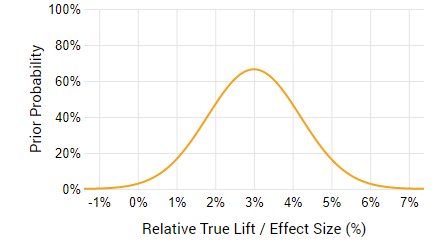
It should be different for each test you run. For example, if you are testing the removal of the “apply a coupon” field from a shopping cart, and you’ve done it already for 10 different shops and observed an average relative lift in average revenue per user of 3% (assuming properly conducted tests!) with confidence intervals averaging +1% to +6%, then it makes sense that you would define a probability distribution centered on 3% and having a standard deviation around 2% relative lift. Thus, it would look something like this:
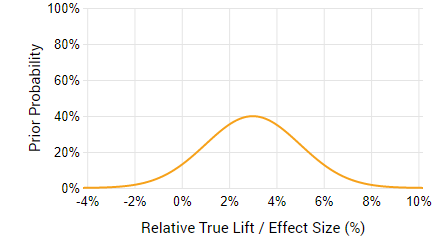
If you are very sure that it will be around 3%, then you might even raise the probability density around that value, like so:
The second distribution obviously excludes more of the negative values and also the higher end of the positive lift values. Of course, it is your subjective judgement which would say whether the results of the prior tests are a good predictor of the current one. Maybe it’s a different industry in which user behavior around promo codes is way different, so the potential gain is way higher, or way lower… This is where expertise comes in.
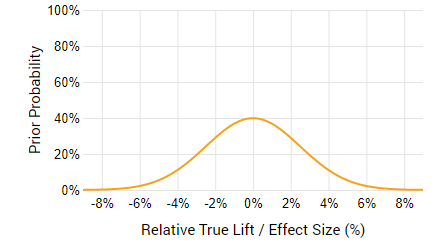
Let’s see another scenario. You are testing a small change, say, in the text of a Call-to-Action button (CTA). You are not really sure it will result in a lift, maybe it’s about 50/50, but you know that such a change is both unlikely to result in a high lift, and similarly – a high loss. So, a prior for such a case would be centered at zero, say like so:
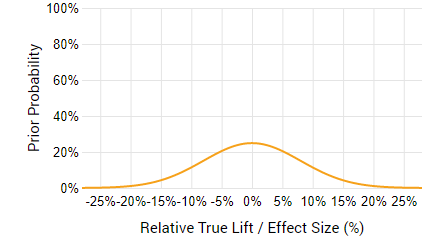
If, however, the change is more dramatic and might result in both a higher risk, and a higher gain, then it can again be centered at zero, but would be more spread out, reflecting the fact that we expecting a wider range of possible outcomes.
Obviously, the prior distribution is to be used to estimate both the probability-adjusted cost, and the probability adjusted gain. Depending on the other parameters, a negative lift might still result in business gains, while a positive lift does not always correspond to a positive gain.
The good thing about all the above is that all these different costs and benefits can be calculated, and risk/reward ratios computed, allowing A/B testing professionals to find the sweet spot between test duration and the level of statistical significance required. We at Analytics-Toolkit.com have built a tool that does just that: by taking several parameters regard the test and the business impact it might have, we produce not only risk/reward ratios, but also automated recommendations for test duration and significance levels that result in an optimal risk/reward ratio. We’ve called it simply: A/B Testing ROI Calculator . You can check it out on our (limited) free trial.
Still, not everything can be taken into account, as there are things an A/B test can’t control, and that can’t really be estimated with any accuracy.
Long-term effects and outside opportunity costs
Long-terms effects, both in terms of costs and benefits, are difficult to measure. Our calculator, for example, assumes that the result will be about the same during the whole exploitation of the implemented variant. However, that need not be the case as novelty effects come into play. Changes in circumstances entirely external to your website can also affect the future behavior of your users, think things like technology shifts, device shifts, major shifts in UX approaches. Any estimation of the longevity of exploitation of a particular variant is also, by necessity, uncertain.
Then, there is a little-studied effect from the constant changes that are characteristic of products which undergo a lot of A/B testing. The homepage looks one way today, another a month from now, then yet another month passes and it is back to what it was initially, same for the shopping cart, same for the registration process, etc.. The header looks one way today, with the phone featured prominently there, while a few weeks later the phone number is gone and is in the footer. Such effects, naturally, would be more pronounced in sites the users frequent, such as news sites, social networks and other properties with high frequency of repeat visits in a relatively short timeframe.
Finally, there is the overall opportunity cost of A/B testing. What if you take the time and money you invest in A/B testing and invest it in something else? As kosher as that sounds, it might actually be better for certain businesses to skip A/B tests and go forward with more risk, but expending resources in another direction. After all, A/B testing is a means to an end, and if that end can be achieved in other ways, without unduly exposing the business to risk from bad decisions, why not do it? This is exactly the reason why in our ROI calculator you will see a calculation for the marginal improvement of the risk/reward ratio, that is how much better off you are if you chose to test, versus if you chose to just go in and implement whatever you are considering for testing. It doesn’t give you the whole picture about opportunity cost, but at least it gives you a comparison which should be helpful if you are interested in calculating it as you should be doing, and not just for A/B testing overall, but for each individual A/B test.
In a subsequent post we explore the interactions between the different types of fixed and risk-adjusted costs and benefits, as well as the costs and benefits pre-test, during testing and post-test. This post is now live at “Risk vs. Reward in A/B Tests: A/B Testing as Risk Management“!
About the author

Managing owner of Web Focus and creator of Analytics-toolkit.com, Georgi has over twenty years of experience in online marketing, web analytics, statistics, and design of business experiments for hundreds of websites.
He is the author of the book "Statistical Methods in Online A/B Testing", of white papers on statistical analysis of A/B tests, and has been a speaker at conferences, seminars, and courses. Georgi has been distinguished as a winner in the Data & Analytics category of the 2024 Experimentation Thought Leadership Awards.

