We just concluded an A/B test on Analytics-Toolkit.com that has been left to run for just over 2 years. And it failed, as in failing to demonstrate a statistically significant effect based on the significance threshold it was designed for. Has it been a waste of time, though, or can we actually learn something from this experiment?
While I generally avoid sharing case studies since most people seem to tend to generalize them too easily, this test can be used to showcase some common problems with A/B testing. I’ll also try to provide some advice on how to avoid them. It is not so much the outcome of the test that is interesting, but rather the mistakes made and also the things we got right.
The topics discussed include:
- how (not) to plan an A/B test
- how our desire to learn and estimate can be detrimental to a business enterprise
- an example of the utility of non-binding futility boundaries in tests planned for sequential monitoring of data
I will also share brief notes on the external validity of the test results.
Backstory and what this test was about
Midway through 2017, Analytics-Toolkit.com has already been operating for 3 years and we had gathered several client testimonials that we featured on our website. However, we felt that not enough people saw these, as they were only featured at the bottom part of our homepage and the testimonials page itself.
Therefore, we figured we can try displaying two testimonials on our free trial registration page and on pages featuring each of the tools part of the toolkit. Naturally, being a provider of A/B testing tools, we wanted to test these changes so we can estimate their effects, as well as get some assurance that we won’t be hurting our website performance.
We had two tests designed. The first was set up to test adding the testimonials to the free trial registration page. The second – to test having the testimonials on our product pages. It is this second test that we are hereby discussing.
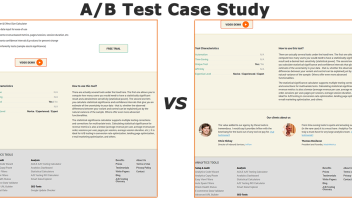
You can see the test control on the left, and the tested variant on the right:
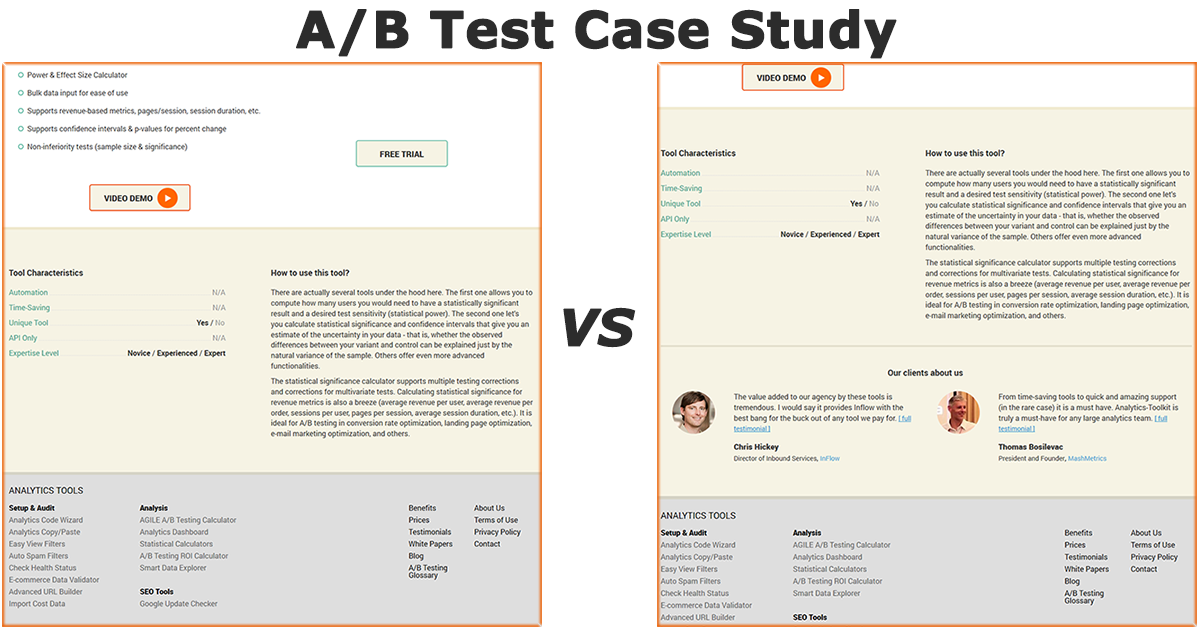
Here is a full size view of the testimonials block we added (click to view in full):
Before launching any A/B test, the first step is coming up with a statistical design which balances the two types of errors – type I and type II, colloquially known as false positive and false negative rates. The output of this process is a significance threshold and sample size. The sample size can be fixed in case of simple designs, or variable in case of sequential monitoring designs where we talk about the maximum sample size.
Immediately, we stumbled into one of the most common issues faced by SaaS websites and small e-commerce enterprises – the small sample size available. Even though we had a decent amount of weekly visitors to the site given our niche, the sample size was way too prohibitive to test for the effects on paid subscription conversion rate (not to mention average revenue per user). This was despite using our AGILE A/B testing method for sequential analysis of test data, which reduces the expected sample size by 20%-80% (depending on the actual effect).
It was decided that the test will use conversion rate to free trial as its primary KPI since this was the only way to have it complete in a reasonable amount of time. The significance threshold was set at 90% (p-value threshold 0.1). It was expected that the A/B test would take at most one year, though with AGILE there was the possibility it will end much sooner.
There is no guarantee that an increase in free trial conversion rate would translate to any change to paid subscriptions, which is the ultimate business goal, for which purpose we should have chosen to keep an eye on that metric as a secondary KPI. At the time, we didn’t do so with any statistical rigor, but elected to simply monitor it to ensure the observed effect there is not negative.
A/B Test Outcome
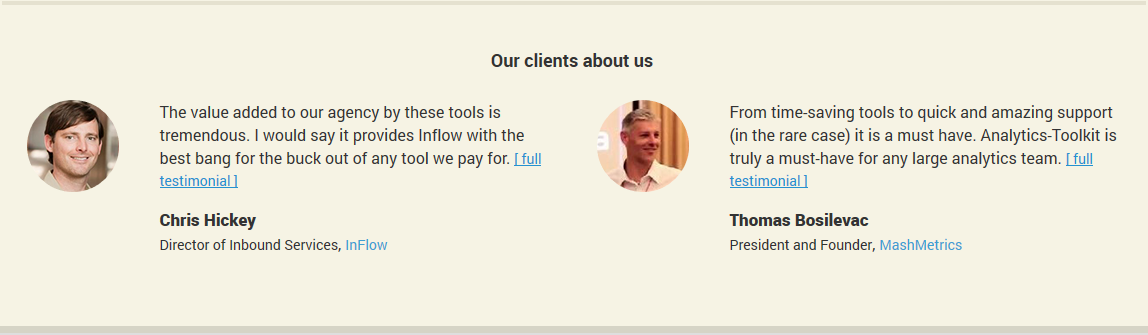
The outcome of the test, as already stated, was that the test statistic failed to meet the significance threshold we have determined – 0.1 or 90% confidence. Since it was analyzed using AGILE, this manifested by the statistic failing to cross the efficacy boundary. In fact, it crossed the futility boundary near the end of the test. Here is what the graph looks like:
With more than 2 years worth of data we observed a 4.57% relative improvement with the treatment beating the default experience. Featuring the testimonials also resulted in an observed 19.44% lift in acquiring paying customers, but this was compensated by customers signing up for lower tier subscriptions, hence the outcome on revenue was barely positive.
We were unfortunate enough to have the observed (and maximum likelihood) effect size being about 1/2 of the target effect size of 10%, which meant that there was a ~23.5% probability the test will take up to 20% longer than a fixed-sample size equivalent. This is what happened, although we could have stopped on the first crossing of the futility bound, cutting the time a bit. More on why we didn’t do that below.
We decided to implement the treatment permanently, which is why you can currently see the testimonials featured on our product pages. This might seem counter-intuitive, given that the test ended with a crossing of the futility boundary. We’ll get to that shortly.
Let us now get into what we could have done better and the different takeaways we can have from this A/B test.
#1: This Test Shouldn’t Have Existed
Yes, that’s right. Even with our initial expectation of the test ending in 1 year, the test simply didn’t make business sense with these design parameters. We discovered fairly early on that we made a mistake in estimating the number of users we would get in a year and that the test would in fact take roughly 2 years to complete. Still, we decided to proceed, hoping for the best and unwilling to alter the design.
Back in 2017 I haven’t yet come up with the theory of how to arrive at ROI-optimal sample sizes and significance thresholds and so had only intuitive understanding of how the different types of statistical parameters relate to business concerns. I didn’t have the A/B Test ROI calculator to help me estimate the marginal utility of running an A/B test with a given design, nor could I estimate the optimal such design in terms of sample size and confidence level. So, while deciding on increasing the significance threshold from 0.05 to 0.1 (2x increase in risk of type I error) and a target effect size of 10% at 80% power, there was only intuitive justification for these numbers. They were not backed up by any calculations.
Having a decent way of estimating the marginal utility of running the above test, several estimations were performed using different assumptions, and all of them showed that it would have been cost inefficient to run the test even with the most modest of testing costs. We would end up losing money if we test with any kind of a superiority hypothesis. To illustrate my point, here is the result of one of these calculations:
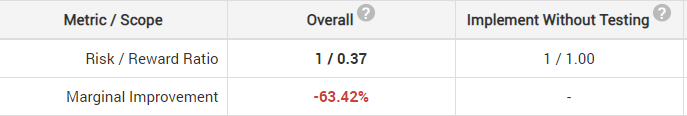
The risk/reward ratio is worse when we test (1 / 0.37), as compared to just implementing the solution (1 / 1), under these particular assumptions. This is a result of the combination of multiple factors, primarily due to the low sample size coupled with a modest weekly revenue.
Our testing costs are quite low since we use an internally developed testing platform, Google Analytics to store data, and our own AGILE calculator for statistical analysis. The cost consists primarily of man-hours spent on deployment and analysis. Even so, the fixed costs of conducting the test, coupled with the potential risk costs from failing to detect a true effect of modest size and of running with an inferior UX for so long and of implementing a false positive, still outweigh the benefits of controlling the risk from a false negative plus the potential benefits from implementing a better UX after the test.
In other words, not only this test shouldn’t have happened, but any kind of test with a superiority hypothesis would be harming our business prospects. It also turned out that reasonable non-inferiority designs also don’t make sense.
What is the alternative, then? If the estimated utility of implementing without testing is better than the utility of testing, one should consider implementing the proposed change without any testing. This is not a new idea. I’ve proposed it as a way to proceed when faced with a prohibitively low sample size an an article I’ve written in March this year. However “kosher” that might sound to many, there are situations where this remains as the best available option.
If you’re wondering, this is one of the main reasons why we seem to have disregarded the outcome of the test. Seem, since crossing the futility boundary simply means that it is unlikely for a positive effect equal to or greater than the minimum effect of interest to be detected with a reasonable probability. It does not mean there is no effect whatsoever.
#2 Don’t Let Curiosity Trump Business Goals
I’m a curious person and so I wanted to use the occasion of this test to see if testimonials would have a positive impact on a SaaS business. I wanted to estimate the impact of our particular implementation in showcasing those client reviews. In doing so I can say that in hindsight, I’ve placed my desire to measure the outcome of my actions above what was expedient for the business.
The test wasn’t reasonable with a one year duration and that was fairly obvious even without employing the mathematical machinery of risk/reward calculation (which I didn’t have at the time). We should have decided to just go ahead and implement, even more so after it became clear there was a miscalculation and the test will actually take two years to complete. In pushing through with the test I didn’t act in an optimal way with regard to getting the benefits Analytics-Toolkit.com offers to as many customers as possible.
Did it turn out to be a learning opportunity? Does it provide us with insight we wouldn’t otherwise have? I think so, but that still doesn’t negate the fact that we could have had a couple percent more users signing up for free trials over the last two years. And who knows what that would have brought?
#3 An Example for the Usefulness of Non-Binding Futility Bounds
On a more technical note, the test provided a good example of the utility of using non-binding instead of binding futility boundaries.
In sequential testing, a non-binding futility boundary allows the experimenter to ignore crossings of the futility boundary due to considerations external to the test data. Contrast that with a binding futility boundary, which while allowing for a slightly more efficient test, does not allow crossings to be ignored. The trade-off is well worth in most cases, which is why non-binding is the default setting in our A/B testing calculator.
The reason we didn’t stop the test when the futility boundary was first crossed is that the other A/B test in which we tested adding testimonials to the registration page showed a 9.26% lift (point estimate: 8.79%, 90%CI [3.98% , 13.63%], p-value (H0: Δ% ≤ 0%) = 0.05). This result was achieved much faster and suggested to us that if we are to expect a positive outcome from the testimonial test on the tool pages, the effect will likely be smaller as these pages are usually visited further back in the user journey. Hence the decision to make use of the non-binding boundary.
In fact, we could have continued the test for another period or two, but we decided that it was long overdue to put an end to it since we’ve already done the ROI analyses and knew the test did not make business sense, regardless of its eventual outcome.
#4 Bonus Takeaway on External Validity
Since this A/B test ran for such a long time, it presented an opportunity to check if any external forces were influencing it, and how would the effect fared long into the future. The representativeness of the users sampled during the test is always a concern as it directly affects the generalizability of any test results, regardless of their statistical validity (see Representative samples and generalizability of A/B testing results or even better – Chapter 12 of “Statistical Methods in Online A/B Testing”, for a detailed discussion on this). Others are too keen to apply “discounting” for test outcomes when they calculate returns over a long period of time, without any empirical basis for it. This anecdotal data supports questioning the later practice while providing for a discussion on concerns for generalizability.
This is the cumulative conversion rate trend over the entire 2+ year duration of the test (click to view full size):
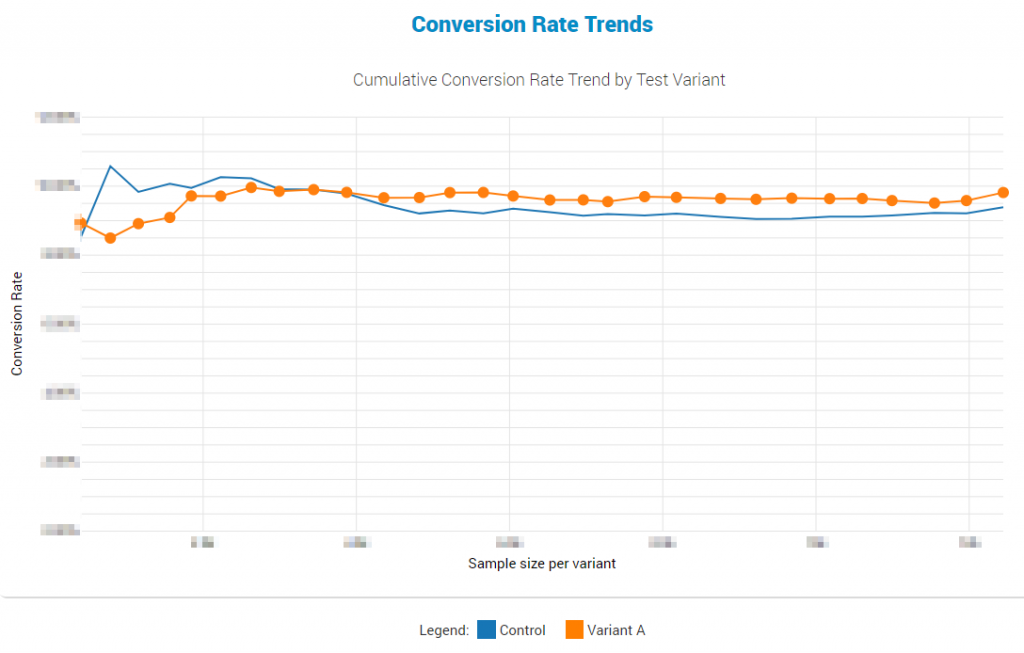
Here we can observe that this particular test was not particularly affected by any external factors over that long a period, which is a good testament to the fact that whatever mechanism is driving the improved performance will remain in operation long after the test has been completed. For this particular test there is no “fall-off” effect of any sort, it seems.
If there is to be found a notable external validity threat, it would be in the early phases where the baseline is outperforming the control. A speculation can be made as to there being a novelty effect in the negative direction. However, the observed negative performance of the treatment could have easily been due to ‘random’ noise and hence not worth investigating.
In comparison, the testimonials test on the free trial page did not show such early dominance of the control over the treatment, while they also demonstrated stability over time, again showing no dissipation of the strength of the effect.
The Success or Failure of a Test Is Not Determined by Its Outcome
If there is a single takeaway you can get from the above test and everything surrounding it, I think this is the most important thing.
The above is a major point I elaborate on in chapter 13 of my book and with this test is just one practical example that demonstrates it – even if the test had resulted in the treatment group performing better than the control, it would have been a failure from the point of the business. Regardless of outcome, Analytics-Toolkit.com would have fared better if we had implemented the testimonials showcase straight away.
If this article can help you make better decisions about what to A/B test and how to avoid ROI-negative tests, then it might have been worth it, in the end.
About the author

Managing owner of Web Focus and creator of Analytics-toolkit.com, Georgi has over twenty years of experience in online marketing, web analytics, statistics, and design of business experiments for hundreds of websites.
He is the author of the book "Statistical Methods in Online A/B Testing", of white papers on statistical analysis of A/B tests, and has been a speaker at conferences, seminars, and courses. Georgi has been distinguished as a winner in the Data & Analytics category of the 2024 Experimentation Thought Leadership Awards.

