Most, if not all successful online businesses nowadays rely on one or more systems for conducting A/B tests in order to inform business decisions ranging from simple website or advertising campaign interventions to complex product and business model changes. While testing might have become a prerequisite for releasing the tiniest of changes, one type of tests are not yet as common as they should be: tests of the A/B testing setup itself!
The importance of testing your A/B testing setup
What do we mean by an “A/B testing setup”? It consists of the combined infrastructure used to randomize users across test variants, deliver test experiences, collect data, and finally perform statistical analysis of the data. It further consists of the statistical design of the test: what base metric is used (impressions, clicks, pageviews, sessions, users, phone calls, etc.) and what primary and secondary outcomes of interest are analyzed (conversion rate, click-through rate, average revenue per user, etc.).
The first part of the testing setup can be a single piece of software, but more often consists of several interconnected pieces, each of which is prone to issues just like the software being A/B tested. For example, one might use Google Optimize to deliver test experiences, Google Analytics to collect the data, and the AGILE A/B Test Calculator to plan and analyze it. Problems like “flicker” (“flash of original content” or FOOC as some call it) in displaying a test experience, improper randomization, missing data due to technical problems, bugs in data extraction or analysis can heavily influence the perceived outcome of any A/B test by altering the observed effect in both size and direction. Even tests that are back-end coded are not immune to many of these problems as has been seen time and again [1,2].
If the A/B testing setup is unreliable or not working as expected its output becomes untrustworthy and any decision based on it will be misguided to some extent. The central function of A/B tests — to serve as a last layer of defense against making business-damaging decisions — would be partially or completely compromised as a result.
And, please, don’t think that a statistical analysis of the results will miraculously adjust for these issues. All statistical models operate on a set of assumptions that need to be fulfilled in order for the results to be applicable to reality. Issues like the ones described above can and often do result in violations of common assumptions and so the model becomes mis-specified and produces inaccurate or misleading p-values, confidence intervals, and other estimates. Decisions based on such untrustworthy tests are themselves not to be trusted.
So, what can be done, other than having a rigorous quality assurance processes for launching tests? Is there something we can do to assess the overall trustworthiness of our A/B testing setup? The answer is that there is a simple, yet powerful statistical test which can be performed that will detect the manifestation of one more issues and this is
The Sample Ratio Mismatch test
A sample ratio is the designed split of traffic between your test control group and its one or more treatment groups. Usually tests are performed with equal allocation for efficiency, and thus in the simplest of cases: an A/B test, the split will be 50% of traffic to the control group and 50% to the experimental group, leading to a sample ratio of 1.
Sample ratio mismatch (SRM) means that the observed traffic split does not match the expected traffic split. The observed ratio will very rarely match the expected ratio exactly. Observing 1000 users in the control group and 1000 users in the treatment group is in fact fairly unlikely, even if all is working as expected. It is much more common to see other ratios such as 989 in the control group and 1011 in the treatment one. How do we tell, then, if a mismatch is large enough to warrant discarding the test results as unreliable?
Under ideal conditions, the observed sample ratio fluctuates in a manner which can be modeled as random error so we can use the chi-square statistic as a goodness-of-fit test to tell if an observed ratio mismatch is different enough from the design ratio to decide there is cause for concern. The Χ2 statistic is simple to compute and can easily be converted to a p-value, which is then interpreted like any other p-value. Observing a sample ratio which would be highly improbable with a properly functioning A/B testing setup should be taken as extreme cause for concern.
For example, if you observed the following outcome from a test, would you be concerned, given it was planned with equal allocation between the test groups?
| Number of Users | Avg. RPU | |
| Control | 15752 | $14.30 |
| Variant | 15257 | $16.52 |
The difference might not seem alarming at first glance, but let us perform the chi square goodness-of-fit test and see what it results in:
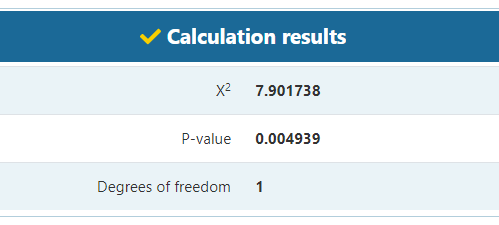
Turns out that such a sample ratio mismatch or a larger mismatch would only be observed in 1 in 200 tests, if the A/B testing setup was working properly (see calculation). In most situations this would be enough evidence to discard the data as unreliable. As Fabijan et. al (2019) [3] state:
While there are many data quality issues that could decrease the validity and significance of a controlled experiment, Sample Ratio Mismatch in most cases completely invalidates experiment results.
“Diagnosing Sample Ratio Mismatch in Online Controlled Experiments: A Taxonomy and Rules of Thumb for Practitioners”, 2019
Note that when the sample ratio mismatch test indicates an issue, it does not tell us where the problem is. The significant mismatch could have been caused by randomization issues, treatment delivery issues, tracking issues, reporting issues, or a combination of the above. Further investigation would be required to determine the root cause and it may be far from trivial.
Say we had a different scenario with 100 users in the control and 90 in the treatment. Then the p-value would be 0.468 – quite high. Note however, that this does not mean there are no issues with the test, it simply means we don’t yet have enough information to discern between a well-conducted test and a poorly executed one. The test simply lacks statistical power. (If you want to get a good grasp of all the statistical concepts mentioned above, I suggest you grab a copy of my book “Statistical Methods in Online Testing”).
When to check for Sample Ratio Mismatch in A/B test data?
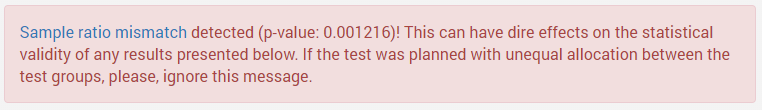
Given its simplicity of implementation my advice would be to use it for each and every one of your tests. If you are using any of our statistical calculators, including the A/B Testing Calculator, a chi square goodness-of-fit test is performed automatically with the assumption of planned equal allocation between groups. For example, you might see something like this when you perform a statistical significance or confidence interval calculation:
If you are using custom statistical software to analyse your A/B tests, the chi square test can easily be added to it as part of the analysis. If you’re using a third-party software you should request they implement this test for you. In all cases you can perform it conveniently using this free goodness-of-fit calculator coded by yours truly.
Whatever your situation, there is really no excuse for skipping the sample ratio mismatch test which can signal serious flaws with your testing rig.
See this in action
Check your experiments for sample ratio mismatch.
Does passing the SRM test mean the data is trustworthy?
In short – no. While the test can detect an important subset of issues with A/B tests – particularly issues related to the statistical validity of any data analysis – there are problems that it fails to detect. Most importantly, issues concerning the external validity of the results, like the flicker effect mentioned above, will often remain undetected. While in some cases the flicker might be accompanied by further problems which would make the data fail the sample ratio mismatch test, in other cases it will not trigger it at all, despite the results being hopelessly misleading.
References
1 Dmitriev P., Gupta S., Kim D.W., Vaz G. (2017) “A Dirty Dozen: Twelve Common Metric Interpretation Pitfalls in Online Controlled Experiments” Proceedings of the 23rd ACM SIGKDD international conference on Knowledge discovery and data mining – KDD ’17 (Halifax, Nova Scotia, Canada, 2017) DOI: 10.1145/3097983.3098024
2 Chen N., Liu M., Xu Y. (2018) “Automatic Detection and Diagnosis of Biased Online Experiments”
3 Fabijan A., Gupchup J., Gupta S., Omhover J., Qin W., Vermeer L., Dmitriev P. (2019) “Diagnosing Sample Ratio Mismatch in Online Controlled Experiments: A Taxonomy and Rules of thumb for Practitioners. In Proceedings of ACM SIGKDD International Conference on Knowledge Discovery and Data Mining (KDD’19), August 4 – 8, 2019, Anchorage, Alaska. ACM, New York, NY, USA DOI: 10.1145/3292500.3330722.
About the author

Managing owner of Web Focus and creator of Analytics-toolkit.com, Georgi has over twenty years of experience in online marketing, web analytics, statistics, and design of business experiments for hundreds of websites.
He is the author of the book "Statistical Methods in Online A/B Testing", of white papers on statistical analysis of A/B tests, and has been a speaker at conferences, seminars, and courses. Georgi has been distinguished as a winner in the Data & Analytics category of the 2024 Experimentation Thought Leadership Awards.

