
Overgeneralization is a mistake in interpreting the outcomes of online controlled experiments (a.k.a. A/B tests) that can have a detrimental impact on any data-driven business. Overgeneralization is used in the typical sense of going above and beyond what the evidence at hand supports, with “evidence” being a statistically significant or non-significant outcome of an online A/B test.
Jumping to an unwarranted conclusion can lead efforts astray in two main ways:
- pursuing poor ideas on the basis of statistically significant tests
- shutting off fruitful avenues of exploration due to statistically non-significant tests
The article first goes over the fundamentals of statistical tests and their role in business decision-making. It proceeds with examples of overgeneralization as well as methods to avoid it.
Table of Contents:
- What an A/B test actually tests
- What A/B tests do not test
- Overgeneralizing from statistically significant tests
- Overgeneralizing from statistically non-significant tests
What an A/B test actually tests
Ideally, one would want to establish how good an idea is, and if not that, then at least how well its applications work in practice as measured by some interesting business metric such as average revenue per user. However, what online experiments and statistical tests offer is much more limited than that.
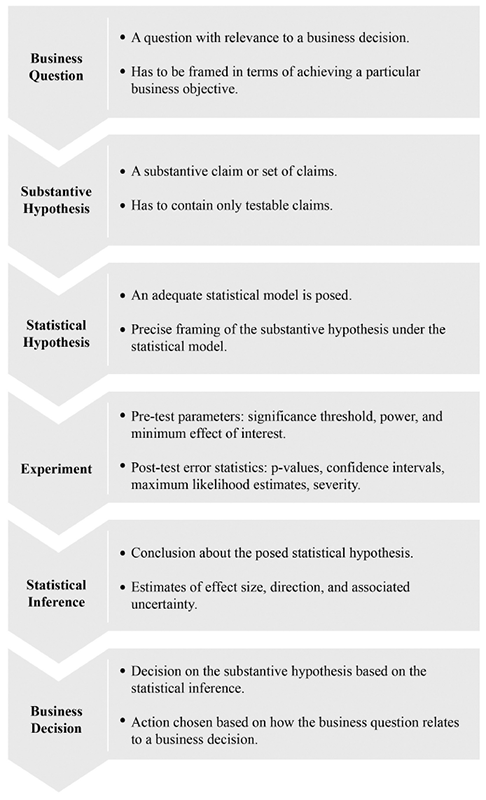
The graph on Figure 1 shows how experiments and statistical inference are embedded in data-driven decision-making. It is from page 30 of my book “Statistical Methods in Online A/B Testing” and has not been shared elsewhere before.
Let’s make the above more concrete with an example scenario.
From idea to hypothesis
Start with an overarching idea, for example that “offering more payment options should be good for business as it should reduce purchase friction”. Reframing it as a more specific “Business Question” (as in Figure 1) can result in:
1) “Is it a net positive to add payment option X to our online checkout?”
Assuming the implementation and maintenance cost of the new payment method is negligible and that the processing fee structure is the same, this can be translated into a “Substantive Hypothesis” with a single primary metric:
2) “Adding payment option X will result in an increase in average revenue per user.”
If the costs are non-negligible, then the above would be “Adding payment option X will result in an increase in average revenue per user of X% or more.”, requiring a strong superiority alternative hypothesis.
For philosophical reasons beyond the scope of this text, testing this hypothesis directly is not possible. Instead we can try to reject its complementary statement:
3) “Adding payment option X will have no effect or would result in a decrease in average revenue per user.”
The above is the substantive null hypothesis.
The statistical hypothesis
A specified substantive null hypothesis allows defining a corresponding statistical hypothesis with a statistical model for difference in means. Sticking to absolute difference for simplicity (instead of relative difference), the model would state that:
- the data being observed has an error distribution which follows a Normal Distribution
- the individual observations are independent and identically distributed (IID)
The two points above result in the familiar NIID statistical model. Each of these model assumptions can be tested with the data at hand. It is important to note that certain departures from these assumptions can have negligible effects on a model’s validity and thus applicability, while others may be very impactful.
The statistical null hypothesis would be one-sided and read like so:
4) Under the NIID model, there is a negative difference or no difference between the two groups in the experiment.
What tests of significance test
Tests of statistical significance probe whether the observed data sufficiently contradicts the null hypothesis defined above, of which the statistical model is an integral part. The question we seek the answer to is: “Assuming the null hypothesis is true, how likely is it that one would observe such an outcome from this particular data, or a more extreme one?” That’s exactly what a p-value estimates. If the observation is sufficiently improbable it can serve as evidence against the tested statistical null hypothesis ( defined in 4) ).
That is it. No more and no less than the above. The same logic generally applies to confidence intervals, but inverted. Point estimates rely on the statistical model defined above in a similar manner. Bayesian methods, especially in the way widely popularized in the industry, are nothing more than computing simple, fixed-sample design, p-values in a more computationally-intensive manner and then inferring from them way more than they warrant, all the while while losing the rigor offered by properly adjusted p-values.
What A/B tests do not test
First of all, the above makes it evident that A/B tests do not test the statistical model itself. They work within the model. Mis-specification tests can and should be performed to ensure the model is fit for purpose. A simple, but powerful tool is to perform a sample-ratio mismatch test (SRM test). Periodically running a number of A/A tests on the experimentation platform is advised to ensure the setup behaves as expected.
Second, due to the Duhem–Quine problem, statistical tests do not test the substantive hypothesis ( defined as either 2) or 3) ) directly. Examples of this will be provided below, but suffice it to say, even assuming the model is well-specified, Duhemian problems preclude making a direct inference regarding the substantive hypothesis.
Third, A/B tests do not test an idea or provide an answer to a business question directly. Tests provide incremental evidence that shows the opposite claim has been put to the test and found lacking. Due to the two points highlighted above, however, their outcomes are not necessarily conclusive on its own.
Naïve generalizing from an A/B test (or a few) to a substantive hypothesis, or (even worse) to a general idea, is unwarranted.
The above is fairly abstract, so let us illustrate it with a few examples.
Overgeneralizing from statistically significant tests
Imagine the test from the scenario outlined above results in a highly statistically significant outcome. For example, the p-value is 0.001, the 95% confidence interval is well into positive territory [+5%, +∞) and so is the point estimate at +10%. The SRM test is fine, and so are the other model assumption checks.
Is this sufficient to accept that the general idea was right and that the answer to 1) (“Is it a net positive to add payment option X to our online checkout?”) is in the positive, or even further, than the idea that the more payment options there are, the better, is valid?
The answer is no to both. For the general idea, it is easy to see that we should not conclude from adding one payment option that adding more would still be beneficial. Perhaps it was something specific to that option that works well, or that we had way too few options to begin with, and after adding this option there is no further room for improvement.
The business question also cannot be answered in the positive based just on the test outcome since the test only considers average revenue per user. However, there is more than this single metric that goes into determining if the change is a net positive for a business. Examples include client feedback, support staff engagement rates, post-purchase survey responses, publicly shared feedback (social media impact), and so on. Take, for example, the adoption of cryptocurrency payments by certain online merchants during the infancy of the crypto craze. In given instances these allegedly resulted in significant media coverage. This is a positive in itself that may not have resulted in an immediate uplift in average revenue per user, but may have helped with brand recognition that pays off in the near future.
One might be wondering, isn’t a positive outcome at least sufficient to reject claim 3) (the substantive null) and to infer the substantive alternative? The latter is stated in 2) as “Adding payment option X will result in an increase in average revenue per user.”.
The answer is again, no, not by itself. For example, what may have occurred is that adding the new payment option X necessitated the removal of information clutter, or said clutter was pushed down the page. Perhaps it was distracting users from completing their purchase, so it was the removal or pushing down of that content which helped, not the addition of the payment option, per se.
Or, it could be that the badge or button showcasing the fact that there is a new payment option drew attention to this section of the checkout and away from others that might have otherwise caused friction. If so, other visual interventions would achieve the same without the investment and expenses involved in supporting another payment platform.
Additional information would often be needed to support inferring the substantive alternative. For example, did a significant percentage of users actually use this new payment method or were they a fraction of what would be needed to explain the observed lift? The former would help whereas the latter would cast doubt on such a causal link. In many cases, there would be other metrics that need to behave as expected to fully credit the intervention with the achieved outcome.
Overgeneralizing from statistically non-significant tests
Just as overgeneralizations from statistically significant outcomes may lead to unwarranted certainty that something has causally affected a key metric, overgeneralizations from non-significant tests can also lead to poor decisions. Namely, one may discard an idea too quickly or fail to spot an implementation issue which, if resolved, might have turned things around.
Assume that the A/B test in which the variant includes adding a new payment method resulted in a p-value of 0.2 with correspondingly wide intervals and a point estimate showing a tiny improvement. Can this outcome warrant not testing other payment methods? Can it be used to conclude this particular payment method is not worth implementing and maintaining.
Not necessarily, and typically not by itself. Regarding the idea of expanding the choice of payment options: it is easy to see how method-specific shortcomings might have been the issue so refusal to try other payment methods is certainly not warranted.
Multiple reasons can explain the poor A/B test outcome without warranting the rejection of a positive effect of the new payment option. For example, the method may have been added in a visually clumsy way, or in a way which made it unclear how to proceed in order to use it. Perhaps an additional step was added which increased user friction, whereas said step can be circumvented in an improved implementation. An expensive API call could be slowing down the version with the new payment method, whereas said API call is not strictly necessary for the method to work. Or perhaps the placement of more information on that step of the checkout overwhelmed users so a reconsideration of the checkout flow in face of the added payment method could result in a positive outcome.
In some cases there would be metrics and/or heatmap data which may support one of these conclusions better than the conclusion that the general idea is bad or that the particular payment option is not working well for the online merchant. For the examples given above, one can check the drop-off rates at different steps, examine the page load speed distributions of the two variants, and look at heatmaps to confirm or reject these auxiliary hypotheses.
P.S. All of the above assumes a reasonably well-powered test. Note that I am not referring to observed power.
What are A/B tests good for
Given the above, is there any use for online controlled experiments at all? There are an infinite number of auxiliary hypotheses which might explain any outcome, so why run A/B tests at all?
While the Duhem-Quine problem remains an obstacle to learning from data, it is not an unsurmountable one. The same problem exists in science, yet it progresses further every day.
When applicable, A/B tests remain the best available tools for inferring causal links and estimating effects. The primary outcome of a test is still the best kind of data available when faced with a decision, and it weighs heavily, but it is not the only thing that has to be taken into account. Secondary outcomes, tertiary outcomes, guardrails, external data, as well as running adjacent tests to rule out probable alternative causal mechanisms are valuable tools that should be used especially when the repercussions of inferring a wrong link are potentially large.
This article is a reminder to not be too keen to jump from a p-value (or posterior) to the probability of a hypothesis or claim, as well as not to quickly adopt (or drop) not just a business proposition, but also a whole idea, only because it “succeeded” (or “failed”) in a single test. Or even in a couple of tests! Overgeneralizing is an easy way to end up with no good ideas left to test or with a bunch of really poor implementation decisions.
For important decisions, and they do become more important the closer they are to an “idea”, confirmation from additional metrics and outside sources should be sought depending on what might follow from making a wrong call. Critically examining a claim by following its logical consequences and checking all available data for its possible rebuttal is the hallmark of rigorous decision-making.
About the author

Managing owner of Web Focus and creator of Analytics-toolkit.com, Georgi has over twenty years of experience in online marketing, web analytics, statistics, and design of business experiments for hundreds of websites.
He is the author of the book "Statistical Methods in Online A/B Testing", of white papers on statistical analysis of A/B tests, and has been a speaker at conferences, seminars, and courses. Georgi has been distinguished as a winner in the Data & Analytics category of the 2024 Experimentation Thought Leadership Awards.

