
In A/B testing sequential tests are gradually becoming the norm due to the increased efficiency and flexibility that they grant practitioners. In most practical scenarios sequential tests offer a balance of risks and rewards superior to that of an equivalent fixed sample test. Sequential monitoring achieves this superiority by trading statistical power for the ability to stop earlier on average under any true value of the primary metric.
Not all sequential statistical tests are made equal, however, and comparisons between the different approaches are rare and/or difficult to translate to practice. Hence the motivation for this piece which is to provide an easy to digest comparison between sequential statistical tests popular in online A/B testing, namely the Sequential Probability Ratio Test (SPRT), the group-sequential AGILE, and Always Valid Inference – a type of mixture SPRT. A fixed sample test will serve as an anchoring benchmark.
An understanding of the trade-offs involved in each type of sequential test should assist experimenters in their choice of a sequential testing method suitable for the scenarios they face.
Motivation
An earlier article titled Fully Sequential vs Group Sequential Tests offers a brief history of sequential testing and a comparison of the two major types of such tests. The three major differentiators, in no particular order, are:
- the effect on generalizability (external validity)
- the average sample sizes under various true values of the primary metric
- the statistical power achieved at any finite sample size
In general, group sequential tests aim for higher generalizability and power through their monitoring schedule and alpha-spending function while achieving less impressive average sample sizes. Fully sequential tests sacrifice more generalizability as well as more statistical power in order to achieve better average sample size.
A majority of the literature on sequential tests focuses significantly on the reduction in average sample size and often insufficient attention is paid to the trade-off in terms of loss of statistical power. Where power calculations are present in published works in the A/B testing literature, they are often in comparison to other tests of the same class or to fixed sample tests in a sometimes not so straightforward manner, making comparisons to other approaches difficult. This leaves practitioners with little guidance on how to choose an appropriate sequential test based on a trade-off between power and average sample size.
While stopping early on average is important, a decrease in statistical power means there is an increase in type II errors, a.k.a. the rate of failing to detect as statistically significant true improvements of practical importance at any given maximum sample size. Missing out on true lifts is something practitioners should deeply care about especially in light of the recent findings regarding the high concentration of lifts around zero. Providing CRO and experimentation specialists with a clear comparison of the trade-offs made by different sequential testing methods aims to alleviate this situation.
Outline
The articles presents a comparison of the three approaches to sequential testing. These are:
- the classic Sequential Probability Ratio Test (SPRT) developed by Wald [1], in a one-sided scenario
- the Always Valid Inference approach proposed by Johari, Pekelis & Walsh [2,3] which is based on mixture Sequential Probability Ratio Tests (mSPRTs) developed by Robbins [4].
- AGILE, a particular group-sequential one-sided test with a futility boundary and a maximum sample size as described in my 2017 white paper [5] (obvious conflict of interest disclaimer!).
The first of these approaches is the most basic and the basis and inspiration of most later work on sequential tests so SPRT serves as a baseline among sequential tests. Always Valid Inference a.k.a. Always Valid P-values has been implemented at Optimizely since 2015 with the arrival of its “New Stats Engine”. AGILE has been implemented at Analytics-Toolkit.com since 2017 and group-sequential designs of one kind or another have since been adopted by others. The three sequential tests will also be compared to an equivalent fixed sample test. Some specifics of the mSPRT will be covered in a separate section. Another section presents a separate comparison of variations of the group-sequential AGILE and similar designs.
The article should be informative about the major classes of frequentist sequential tests applied in A/B testing software.
The A/B test
A hypothetical A/B test with the following parameters will serve as the basis of all comparisons:
| Parameter | Value |
|---|---|
| Baseline conversion rate | 0.05 |
| Target alpha / Confidence threshold (%) | 0.05 / 95% |
| Target beta / Target power (%) | 0.2 / 80% |
| Minimum effect of interest | 0.01 |
| Null hypothesis | CRB-CRA ≤ 0 |
| Alternative hypothesis | CRB-CRA > 0 |
| Fixed horizon sample size per test group | 6424 |
CRA is the conversion rate in the control group and CRB is the conversion rate in the treatment group. Absolute difference is used as a primary metric to simplify the math, even though relative difference would typically be of interest. The large minimum effect of interest is chosen so that the sample sizes required are in the thousands, making the simulations more tractable. Alpha of 0.05 and beta of 0.2 correspond to the type I and type II error rates many tests are examined at in the literature making for a convenient comparison, if necessary.
While the outcomes of the simulations are for this particular setup for the sake of the simplicity of presentation, they generalize well across the whole range of typical values for all of the above parameters.
Simulation setup
Since both SPRT and mSPRT are designed to have no maximum sample size, the maximum sample size of 7045 per test variant required for the AGILE test to achieve the target beta was used for the power comparisons.
SPRT evaluations were done once every 10 data points (users, sessions, etc.) for a total of 704 evaluations (7040 data points) to increase the speed of the simulations which would have taken an inordinate amount of time otherwise. Limited checks confirmed that this approach does not result in a meaningful change in the statistical power of the procedure.
AGILE tests were performed with the parameters specified in the AGILE white paper: an alpha-spending efficacy bound using a Kim-DeMets Power function with ρ = 3; a beta-spending futility bound using a Kim-DeMets Power function with ρ = 2. The maximum number of interim and final analyses was chosen to be 5, reflecting a typical test duration of five weeks. AGILE tests using other values of ρ or number of analyzes would be specifically denoted as such.
The Always Valid Inference (AVPV) simulations were performed with a mSPRT mixing distribution defined by a mixing variance γ* computed with τ = 0.02 as per the instructions for choosing an optimal value presented in Johari, Pekelis & Walsh [3]. The choice of optimal τ reflects information about the target alpha, the expected standard deviation, and the maximum sample size. The inclusion of the latter has significant implications on the procedure’s statistical power as will be discussed.
Statistical power comparison
The statistical power levels of the three sequential procedures with 7045 maximum sample size per group and a fixed sample test equivalent are presented below.
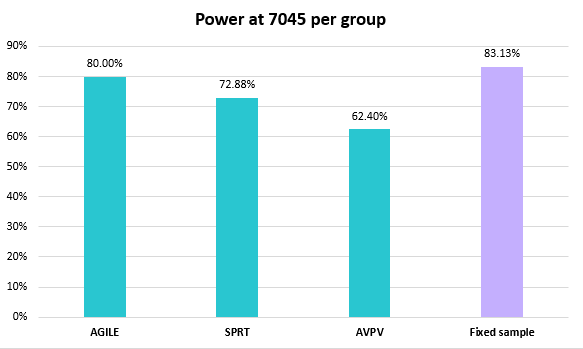
AGILE expectedly achieves its target 80% power. The fixed horizon test achieves just over 83% with the same sample size making the power trade-off of sequential testing obvious. SPRT takes second place among the sequential tests with just below 73% power, while Always Valid Inference (AVPV) trails all with an achieved power level of 62.40% (*).
The difference between the approaches can also be examined through the inverse type II error rate:
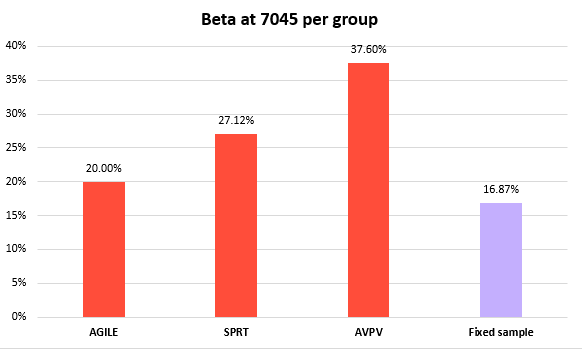
Using Always Valid Inference results in roughly 1.9x the error rate compared to AGILE, and ~1.4x that of Wald’s Sequential Probability Ratio Test. While the 18.5% type II penalty incurred by AGILE versus fixed sample is significant, it is even more so for the other approaches whose increases are in multiples even against AGILE.
Yet another way to view the differences is through the sample size required to achieve the target 80% statistical power level for each approach:
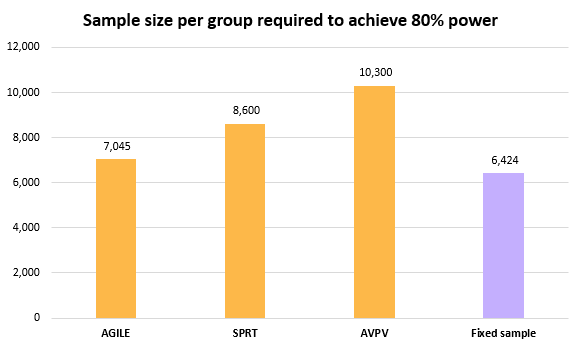
As a mirror image of the beta inflation a test relying on Always Valid P-values requires nearly 85% larger sample size to achieve the same power. SPRT needs just 22% higher sample size in comparison.
The above differences in power and type II error rate are explained by both the number of interim analyses and by the alpha-spending behavior which differs in approaches with no maximum sample size.
Average sample size comparison and trade-off with beta
With such sacrifices to power, one would expect significant differences in the average sample size needed to cross a decision boundary in the three approaches to sequential A/B testing. However, the average sample sizes achieved by the sequential tests under the minimum effect of interest (part of the alternative hypothesis) do not differ as substantially:
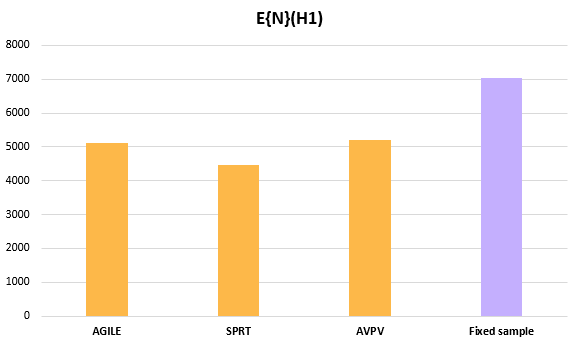
The full distribution of the stopping sample sizes / stopping times of the three sequential tests is available in Appendix I below.
Expectedly, all sequential tests achieve lower average sample size (a.k.a. average sample number, ASN) compared to their fixed horizon equivalent. SPRT has an expected sample size 37% less than that of a fixed sample test at the cost of a 61% increase in its type II error. Always valid inference does much worse by exchanging a 26% reduction in average sample size for a staggering 123% higher type II error rate.
AGILE trades an 18.5% increase in the type II error rate for a 28% reduction in average sample size. The latter is slightly better than Always Valid Inference and worse than SPRT. The comparison may not seem fair since both SPRT and AVPV do not possess a futility stopping bound. However, since the true value is that of the minimum effect of interest the stopping time is dominated by the efficacy boundary. As result, the average sample size of just the AGILE experiments stopped for efficacy is slightly lower than AGILE overall.
Indeed, it may be argued that group sequential tests would be more fairly represented by a one-sided efficacy-only design as it achieves 82.5% power (17.5% beta) with an expected sample size only slightly worse than the one achieved by AGILE. Since AGILE would be the preferred design in most situations it is the group sequential test of practical importance.
The trade-off between an increase in the type II error rate and average sample size can be visualized on a scatter plot:
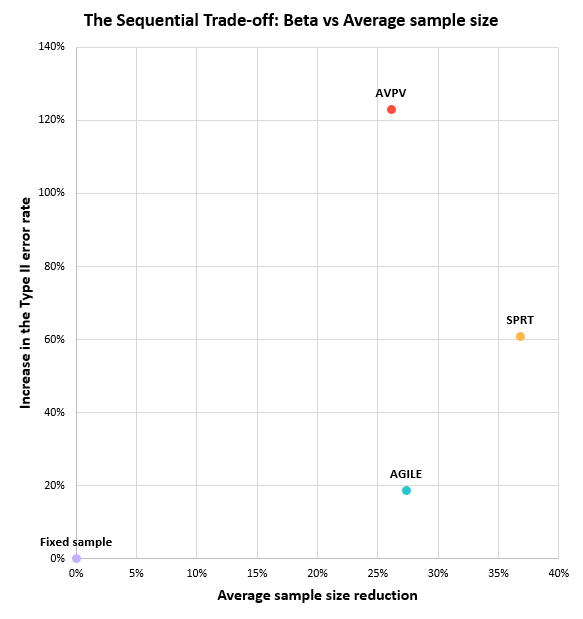
The closer the point is to the lower-right corner, the better.
It should be noted that the above graph is significantly misleading since the y-axis is not properly scaled in order to fit AVPV in without making the graph unduly high. Plotting just AGILE and SPRT, the trade-off can be properly shown, resulting in the following graph:
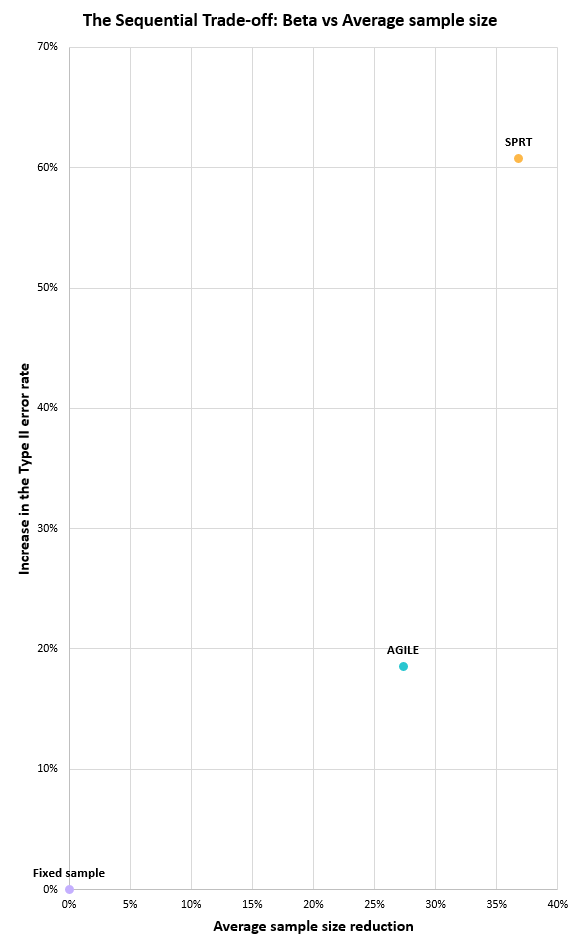
In the graph, the closer the point is to the lower-right corner, the better the achieved trade-off. If a test was able to achieve a non-zero point on the x-axis with zero on the y-axis, that would be what we call “free lunch”. It is actually proven to be impossible since the fixed horizon test is a Uniformly Most Powerful (UMP) test for these parameters.
It is evident that the group-sequential AGILE makes the best trade-off, followed by SPRT and then at a distant third comes mixture SPRT as implemented in Always Valid Inference (AVPV). Applying a fully sequential test without a defined maximum sample size comes at an added cost. Even though some such tests allow for shorter test durations on average as the SPRT demonstrates, it does come at a highly disproportionate cost in terms of statistical power unless one actually must analyze the data streams continuously and can implement automated actions after each analysis. While such situations definitely exist, the above comparison of the trade-offs involved provides a strong argument for using a group-sequential design such as AGILE in all other scenarios.
Dependence of Always Valid Inference on the mixing distribution
Since the results for mSPRT appeared puzzlingly inefficient in terms of the trade-off between power and average sample size, the question of the choice of the mixing distribution became relevant. As Johari, Pekelis & Walsh [3] note:
Across all cases, we find that γ misspecification of around one order of magnitude leads to a less than 5% drop in average power, and no more than a 10% increase in average run-length. Missing by two orders of magnitude, however, can result in a 20% drop in average power and a 40% increase in average run-length.
where γ is the mixing variance defined ultimately by three parameters: α, σ, and the expected sample size of the experiment M. Given the large effect the choice of the mixing distribution can have on statistical power, an optimal value was chosen based on α = 0.05, σ = 0.2179, and M = 7045, resulting in the power and average sample size performance presented above.
To minimize the possibility of suboptimal use of the method, different values of M were supplied and additional simulations were run to determine its effect on statistical power. It was found that for M = 28180 (4 x 7045) the statistical power improved ever so slightly, whereas for M = 1761.25 (7045 / 4) the statistical power was noticeably lower.
Additional confirmation for the fact that mixture SPRT incurs an inordinate power penalty was found in Abhishek & Mannor [6] where empirical results show a loss of power reaching 20%, albeit for a bootstrap variant of a mixture SPRT. Authors of the Always Valid Inference paper were also approached for guidance on how to best apply their work to these simulations as early as Nov 13, 2022, but none have responded by the time of publication.
The dependence of the mixture distribution and through it – the power of the test, on the expected sample size means that to run tests with optimal power and average sample size trade-off under the Always Valid Inference framework one has to specify a maximum test sample size. Given that running tests without first specifying a maximum sample size the loss of power can be from moderate to fairly high the Always Valid Inference type of mSPRT may be viewed as a fully sequential test with a maximum sample size.
Given all the above, the mSPRT test seems to show underwhelming results regardless of the generous setup through a clairvoyant specification of the mixing distribution with regard to the maximum sample size.
Power of group-sequential tests with different parameters
While in the above simulations AGILE tests were restricted to five analyses in total, the impact of the number of interim analyses on the statistical power may be of additional interest. The results of choosing an AGILE sequential test with 5, 8, 12, 20, and 30 analyses are plotted below:
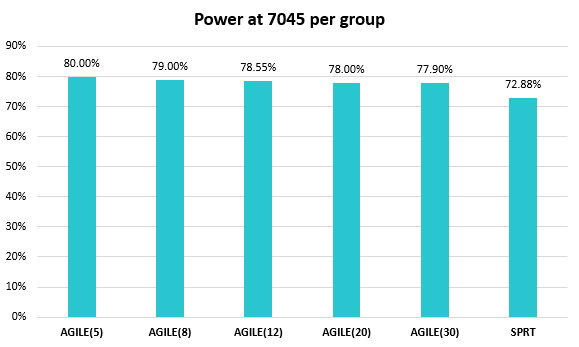
A jump from 5 to 30 analyses decreases the statistical power of the A/B test by just 2.1 p.p.. The expected sample size also decreases by nearly 10%, so the relative trade-off is slightly worse than having just five analyses, but not by much.
AGILE being just an application of a class of group-sequential tests with a particular set of parameters, it was deemed of interest to also examine the effect the shapes of the efficacy and futility boundaries have on the power and average sample size of the test with results shown below:
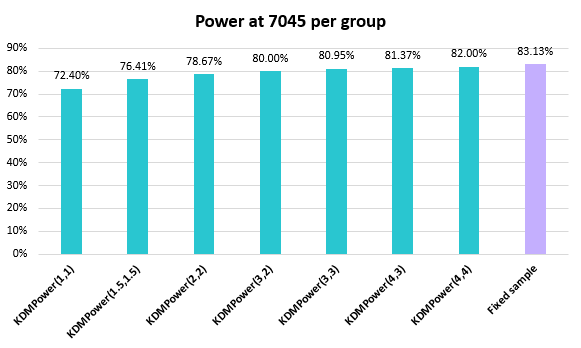
On the one hand, there are more powerful boundaries that those used in AGILE (KDMPower(3,2)), but they also result in increases of the average sample size. On the other, there are more efficient boundaries vis-à-vis the average sample size, but they come at the cost of a significant reduction in statistical power. For example, KDMPower(1,1) achieves power roughly equal to that of SPRT, as well as lower than SPRT’s expected sample size. The AGILE approach aims to balance performance and efficiency with external validity. A sacrifice of some statistical power and efficiency is justified with an improved generalizability which is why it uses KDMPower(3,2).
Discussion
It is well-established that sequential methods trade a loss of power for the ability to stop earlier than their fixed sample equivalents, on average. This article explored the statistical power and average sample sizes of several different sequential tests used in online A/B testing and presented results related to the efficiency of the trade-offs they make.
A group-sequential design with futility stopping and conservative spending of alpha and beta at early stages such as the one used in the AGILE framework is found to achieve a demonstrably better trade-off between statistical power and average duration when compared to two alternative methods, as well as compared to a fixed sample size A/B test. It has the highest power among the sequential tests while achieving an average sample size comparable to Always Valid Inference when the true value equals the minimum effect of interest.
The advantage of AGILE is maintained even for very numerous (by group-sequential standards) data evaluations such as thirty. Group-sequential designs different than AGILE provide similar performance given that their bounds are conservatively spending in early stages. The additional quality of these designs to produce better external validity of the outcomes has not been investigated in this article, but deserves a mention as it is a key factor in the decision to spend less alpha and beta early on.
SPRT showed a significantly worse trade-off compared to AGILE. Despite this, there are situations where fully sequential tests and tests without a defined maximum sample size are called for and so SPRT seems to be a decent choice.
Always Valid Inference, a type of mixture SPRT, showed a trade-off between statistical power and average sample size multiple times worse than even SPRT. This is despite a favorable treatment in terms of ideal specification of the maximum sample expected for the experiment. Since such ideal knowledge is improbable in real-world applications, the performance under alternatives was explored and found to be from roughly equivalent to even worse, depending on the direction of the discrepancy between expected and observed maximum sample size. While Always Valid Inference may have other benefits, the efficiency with which it trades power for average sample size trails that of the other available sequential methods.
Overall, the results show that, when applicable, the group-sequential AGILE design should be the preferred choice given the achieved trade-off between power and average sample size.
References
1 Wald, A. 1945. “Sequential Tests of Statistical Hypotheses.” The Annals of Mathematical Statistics 16: 117-186. doi:10.1214/aoms/1177731118.
2 Johari, R., Koomen, P., Pekelis, L. & Walsh, D. 2017. “Peeking at A/B Tests: Why it matters, and what to do about it”, ACM, 1517-1525. doi:10.1145/3097983.3097992
3 Johari R., Koomen P. Pekelis L., Walsh D. 2022. “Always Valid Inference: Continuous Monitoring of AB Tests”. Operations Research 70(3):1806-1821. doi:10.1287/opre.2021.2135
4 Robbins H. 1970. “Statistical methods related to the law of the iterated logarithm” The Annals of Mathematical Statistics p.1397-1409
5 Georgiev G. 2017 “Efficient A/B Testing in Conversion Rate Optimization: The AGILE Statistical Method”, self-published, available online at https://www.analytics-toolkit.com/pdf/Efficient_AB_Testing_in_Conversion_Rate_Optimization_-_The_AGILE_Statistical_Method_2017.pdf
6 Abhishek V., Mannor S. 2017. “A Nonparametric Sequential Test for Online Randomized Experiments”, ACM, 610–616. doi:10.1145/3041021.3054196
* CORRECTION introduced Mar 4, 2023: An issue was discovered with the initial simulations with the help of colleague Lukas Vermeer. Initially, the power of AVPV was incorrectly estimated at 51.64%, which promulgated throughout the article. Changing this with the correct number of 62.40% and updating all the linked numbers and graphs in no way change the overall picture compared to the initial version of this article.
Appendix I – Distribution of Stopping Times
This short appendix includes distributions of the stopping times of the three sequential tests from 10,000 simulations each, which may bring more insight into the variance of the sample sizes on exiting the indecision region (terminating the test). It is mostly a reflection on how the different tests approach alpha spending, as well as the evaluation points. The latter is most notable for AGILE which, with just five evaluations has all of its stopping sample sizes grouped on these five points.
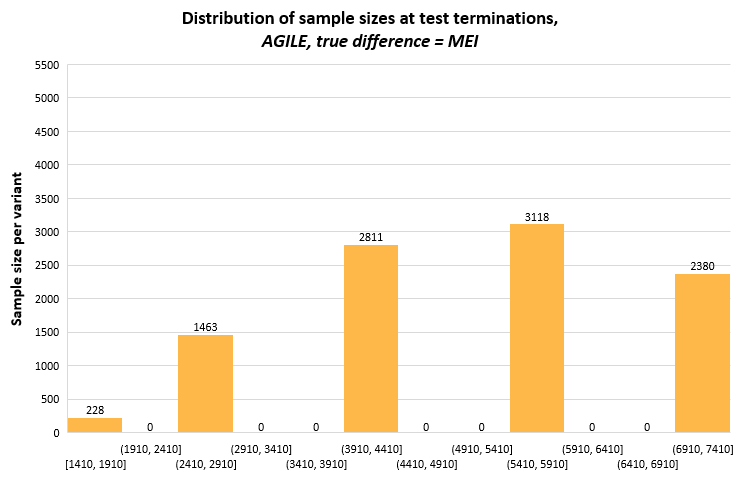
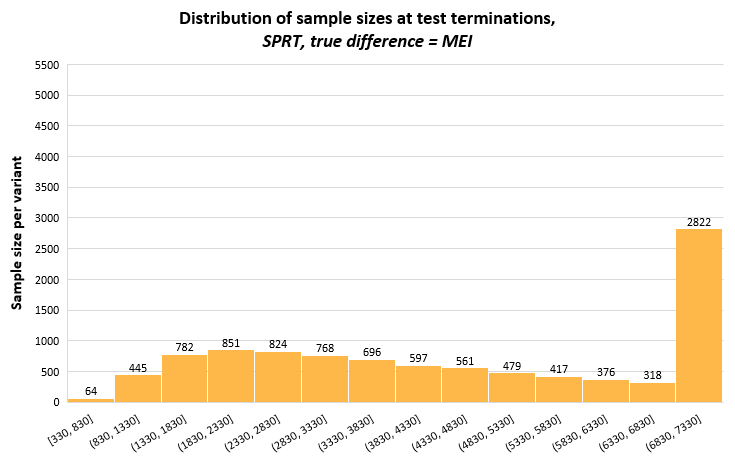
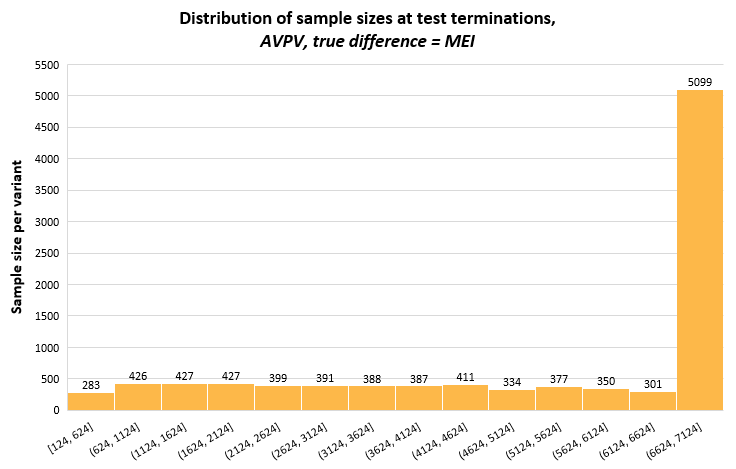
The graphs have the same range on the y-scale to facilitate comparisons between the methods. The bin width on the x-axis is the same for all, but it spans different ranges, most notably for AGILE which has its first data evaluation at 1409 data points per variant.
About the author

Managing owner of Web Focus and creator of Analytics-toolkit.com, Georgi has over twenty years of experience in online marketing, web analytics, statistics, and design of business experiments for hundreds of websites.
He is the author of the book "Statistical Methods in Online A/B Testing", of white papers on statistical analysis of A/B tests, and has been a speaker at conferences, seminars, and courses. Georgi has been distinguished as a winner in the Data & Analytics category of the 2024 Experimentation Thought Leadership Awards.

