This short post presents several changes, updates, and new tool functionalities released in the past couple of months – some very recent, some less so. The updates concern all statistical calculators for design and analysis of A/B tests at Analytics-Toolkit.com and consist of the following:
- New tool: Statistical Calculator for Meta Analysis
- Quality of life improvements to the A/B testing calculator
- Changes to the A/B Testing ROI calculator
Read on for details.
Statistical Calculator for Meta Analysis of A/B Tests
We’ve released a brand new statistical calculator as part of the set of calculators in the tool called ‘Statistical Calculators’. To our knowledge this is a first of its kind for the CRO industry.
The meta analysis statistical calculator can be used to summarize effect sizes and their uncertainty across a number of different tests of the same intervention as well as the effects of an entire CRO/UX improvement campaign consisting of dozens of tests (up to 100!). You can use it to assess the cumulative effect of all your A/B tests in a given year, or to work out the average effect from two or more tests of either the exact same change (if it was retested later due to generalizability concerns, or just as a confirmatory test) or the same type of intervention across a set of websites.
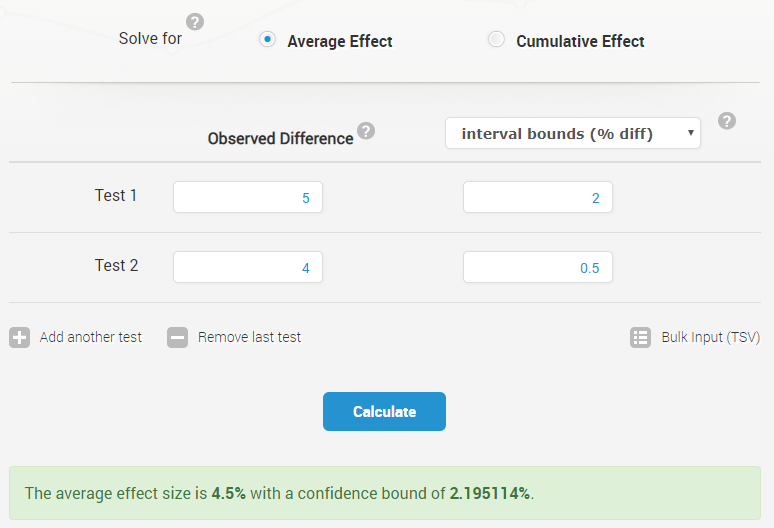
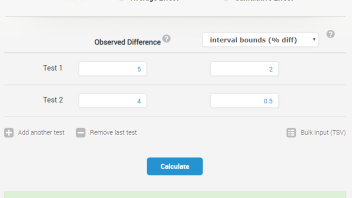
The interface is similar to our other tools, with valuable contextual help available upon clicking the question marks, as usual. The supported input options for effect size includes:
- absolute effect size
- relative effect size
- percentage relative effect size
The effect size is simply the absolute or relative difference between the winning variant and the control an A/B or A/B/n test. The only condition is that they are all of the same type, e.g. you can’t enter an absolute difference for one test and percentage lift for another.
The input options for the measured uncertainty are similarly versatile. The tool accepts as input:
- p-values (e.g. 0.01)
- Z-scores (e.g. 2.05)
- confidence levels (e.g. 99 for 99%)
- interval bounds for percent change (e.g. 10 for 10% percentage change)
- interval bounds for relative change (e.g. 0.1 for a 10% change)
The only option not currently supported is confidence interval bounds for absolute change as we believe these are rarely called-for in practice. This versatility should ensure that our meta analysis calculator will work for you no matter your statistical reporting preferences.
Obviously, the accuracy of the meta analysis calculator depends entirely on the adequacy of the statistical calculations used to arrive at the uncertainty measure. For example, p-values should be adjusted to account for multiple variants (in A/B/n tests), and the same goes for z scores and interval limits.
In a similar way, a mismatch between the measure for the effect size and the uncertainty measure will lead to an inaccurate result. You can’t enter relative differences and p-values for absolute difference, or vice versa. If the effect size is in terms of percentage change, then the corresponding interval limit should come from a confidence interval for percentage change.
A/B Testing Calculator Updates
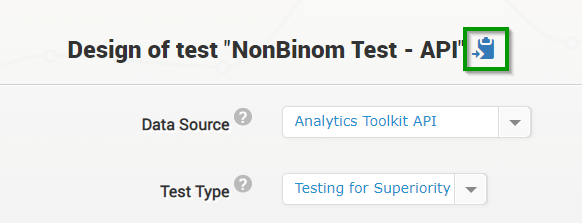
We’ve made a small quality of life improvement to our A/B Test Calculator tool. It is now possible to copy/paste the statistical design parameters from one test to another with the click of a button.
This is useful when relaunching a test stopped due to technical issues or when a new A/B test will have the same value of many of the design parameters of an older one for some other reason.
We’ve also promoted our custom API from beta to production. This is after several months of fairly intense issue-free usage by some of our more advanced customers. We are especially grateful for the feedback provided by Yoav Aner from the Kenhub team. The API supports both binomial and non-binomial metrics making it fully aligned with the A/B testing calculator.
A/B Testing ROI calculator Updates
We’ve made two changes to the A/B Test ROI calculator which is a tool that allows you to estimate an optimal test duration (sample size) and significance threshold depending on business considerations specific to each test. Optimal in the sense that achieves the best possible balance between potential risk and potential reward. Setting the sample size and significance threshold in turn determines the power for any given effect of interest, as well as the minimum detectable effect at 80% power.
The first change is that we’ve altered the way an AGILE design was planned so that now the maximum test duration matches the set number of weeks exactly, even though it is very unlikely that it will ever be reached. This is to align the process between using the A/B Test ROI calculator and our AGILE A/B testing calculator.
Previously the tool simply used the same parameters as the fixed sample size test, leading to the possibility of the test to run with a larger sample size in certain low probability scenarios. In the old situation one needed to slightly adjust the minimum effect of interest if they wanted to have a maximum test duration equal to the one used in the risk / reward analysis. With the new alignment the parameters obtained from the risk / reward analysis can be transferred directly into an AGILE test design in a conservative manner – your test is guaranteed to stop before the maximum number of weeks obtained from the A/B test planner.
The second change is in how the calculator computes the total revenue impacted by an AGILE test. Previously the A/B Test ROI calculator used an extremely conservative estimate essentially equating an AGILE test to its nearly worst-case scenario (in which it runs with a sample size equal to an equivalent fixed sample test). Now the tool uses the average sample size calculation – essentially a statistical average expectation, to more accurately predict the impacted revenue. This leads to a more accurate estimate for the total revenue impacted as well as the risk / reward ratio. The effect depends on the ratio of the test duration versus the post-test exploitation period.
The first change leads to comparisons between fixed-sample size tests and AGILE tests in the ROI calculator being slightly less favorable for AGILE across all possible scenarios. The second change leads to a fairer treatment of AGILE tests which might lead to moderate and even large improvement in the risk / reward ratio of an AGILE test when the post-test exploitation period is relatively short, and to small to negligible improvements in other cases. Most realistic scenarios should fall into the second category.
These changes have no effect on the risk / reward calculations for fixed sample size tests.
Feedback Appreciated
As always, feedback from our users is appreciated. We are happy to hear your opinion and experience with the above new tools and updates through our usual channels.
About the author

Managing owner of Web Focus and creator of Analytics-toolkit.com, Georgi has over twenty years of experience in online marketing, web analytics, statistics, and design of business experiments for hundreds of websites.
He is the author of the book "Statistical Methods in Online A/B Testing", of white papers on statistical analysis of A/B tests, and has been a speaker at conferences, seminars, and courses. Georgi has been distinguished as a winner in the Data & Analytics category of the 2024 Experimentation Thought Leadership Awards.
