After many months of statistical research and development we are happy to announce two major releases that we believe have the potential to reshape statistical practice in the area of A/B testing by substantially increasing the accuracy, efficiency and ultimately return on investment of all kinds of A/B testing efforts in online marketing: a free white paper and a statistical calculator for A/B testing practitioners. In this post we’ll cover briefly the need for a new method, some highlights of the method we propose and a brief introduction to the software tool we’ve developed to help apply it.
The result of our research we call the “AGILE A/B Testing Approach”. AGILE offers significant flexibility and greatly increased efficiency in performing any kind of A/B test. We believe it also addresses most if not all of the major statistical hurdles in doing proper AB and MVT tests in conversion rate optimization, landing page optimization, e-mail marketing and online advertising optimization in general.
In developing AGILE we did a very extensive research in the theory and practice of frequentist sequential testing ultimately focusing on the medical field due to immense similarities between the business case in AB testing and the scientific research case in medical testing. In both settings, the goals are:
- to ship/implement effective treatments as quickly as possible
- to minimize exposure of test subjects to ineffective treatments
- to optimize the amount of resources, committed to an experiment, relative to the expected utility
Another reason to prefer statistical methods developed for medical testing is that they undergo severe scrutiny before being used in practice and most statistical procedures AGILE is built upon have been in use in the medical field for years or sometimes decades.
The highlights of AGILE are:
- Significant efficiency improvements: 20%-80% less users needed vs. classical fixed-sample tests (50-60% on average*)
- Great flexibility in monitoring results and decision making
- Optional stopping issues are solved with statistically rigorous rules for early stopping for efficacy
- Fail fast! Statistical guidance to terminate a test early when it is unlikely to see a minimum desired effect
- Post-test estimates for % true lift, confidence intervals and p-value with reduced conditional bias
The result from applying the AGILE approach to A/B testing is a greatly improved efficiency and thus ROI (Return on Investment) while maintaining the ability to control the uncertainty (error probability) in the experiments. Having a reliable measure of the effects of any AB testing treatment and the uncertainty of the measure enables decision-makers to make smart choices and move their business in the right direction with greater confidence.
The efficiency gains compared to fixed sample tests come from the use of rules for early stopping for efficacy and for futility (lack of practically-significant effect, non-superiority). Using these flexible early stopping rules results in an average gain starting from ~20% in the worst case scenario (true difference is just below the minimum effect of interest) and reaching ~80% in the best case where the true lift of the tested variant is significantly higher or lower than the minimum effect of interest.
Why Is There a Need for a New Statistical Method in A/B Testing?
With AGILE we address the core reason why many practitioners are tempted to and every so often do apply statistics in sub-optimal or outright wrong ways: the fact that the classical statistics, used in most of A/B testing, are not fit to the use-case and thus are both very inefficient and prone to misuse.
For example, classical procedures for calculating statistical significance require fixing the sample size (e.g. number of users, session, e-mails) in advance and never looking or acting on interim results. Looking or peeking and acting on the results is called optional stopping and makes the error-guarantee given by a naive statistical significance computation near-useless, even with a small number of such “peeks” (see “The Bane of AB Testing – Reaching Statistical Significance“). Such inflexibility is completely incompatible with the practical application where there is pressure to review and act on results as quickly as possible, and also results in significant inefficiencies.
Another significant issue with current approaches is the lack of rigorous rules for stopping for futility (lack of effect), leading to unnecessarily prolonged tests where there is very little chance to detect any meaningful discrepancy. There is also very little use of rules for declaring non-superiority, or that a variant is no better than the control – the p-value / statistical significance alone cannot provide any such conclusions. Finally, lack of consideration for the power, or sensitivity, of a test, especially combined with peeking, often results in unnecessary amount of missed true winners (see “The Importance of Statistical Power in Online A/B Testing“).
Seeing all these issues plague the industry and the resulting sub-optimal or potentially negative returns is what motivated us to develop the AGILE statistical method.
The AGILE A/B Testing White Paper
Details about the improved statistical approach we developed are available in our white paper “Efficient A/B Testing in Conversion Rate Optimization: The AGILE Statistical Method“, available for free download from our website. It contains an in-depth look into the statistical basis of the approach, a step-by-step guide to running an AGILE test, including guidance on choosing proper design parameters and on interpretation of the results.
While the paper focuses mostly on CRO, the method is 100% applicable to landing page optimization, e-mail template optimization, ad copy optimization and other areas where A/B or multivariate testing practice can bring value. Despite its considerable volume the white paper should be a fairly light read for most of our readers, while also providing proper explanation and complete references for the more statistically-savvy among you.
AGILE A/B Testing Calculator Released

We have developed a complete solution for applying the AGILE statistical method in practice, without the need for deep statistical expertise: our AGILE A/B Testing Calculator (limited, non-obligatory free trial is available). In it we have automated the statistical procedures to a fair extent, making the design and analysis of A/B tests using the AGILE A/B testing approach as seamless and straightforward as possible.
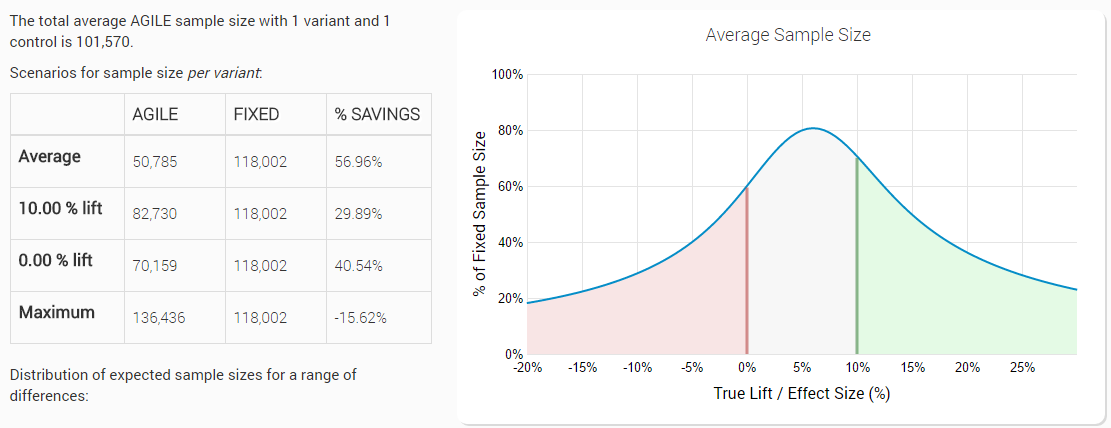
In the design part of the interface we try to give you enough information to make the decision of whether the chosen design parameters are right for your particular test. We do so in a nice graphical way, with plenty of explanation to go with the graphs. Below is an example of the estimations for expected sample size for a given test design:
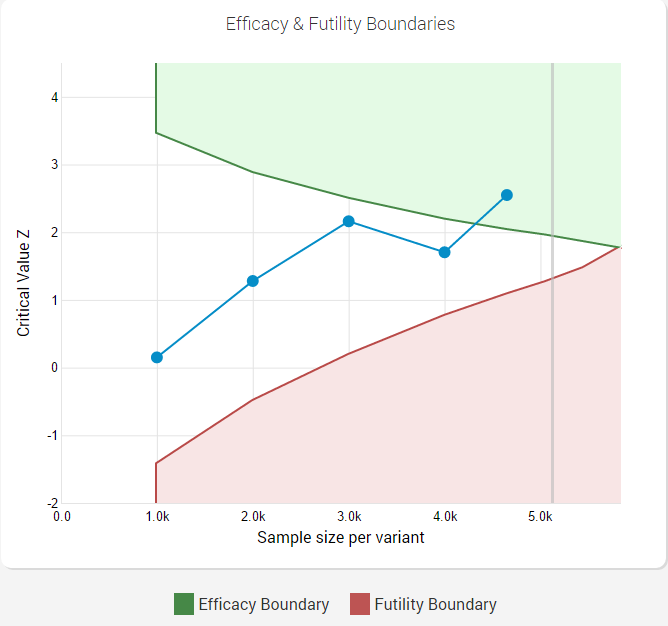
Here is an example of a test that successfully declared a statistically significant winner, in this case with slightly less users than a proper fixed-horizon test would have required:
The whole interface is fairly intuitive and full of contextual information about the various “knobs”, “levers” and “gauges”, should you happen to need it.
We recommend that if you are not yet a user of Analytics-Toolkit.com, you sign up for a free 14-day trial. Due to the limited time, it will likely not allow you to design and execute a full A/B test, but the trial should be enough to get a very good feel of the design process, while you can use data from past experiments and run them through the calculator in order to get an idea of how that part of the process works.
The AGILE A/B Testing Calculator is not a fully-fledged A/B testing platform by any means. It is a tool to help you plan and analyse results from A/B testing experiments. While this means that you would still need some solution in order to develop and deploy tests, it also means that it is applicable where other solutions are not. In short, you can use it for any kind of A/B testing situation, given that proper randomization for the arms of the experiment is available.
If the platform you use syndicates data to Google Analytics by using custom dimensions to differentiate between the different arms of the experiment, then our tool can automatically extract your test data, saving you a lot of manual data-entry work.
Short video preview of the tool (~1.5 mins):
Concluding Remarks
We’re really excited about these releases and we’d be happy to hear your feedback on both the white paper and the calculator tool – in the comment section below or through our contact form.
There will be a series of posts on the different aspects of the AGILE statistical method for conducting online experiments, as well as commentary on some issues with existing approaches, so subscribe to our RSS and follow us on social media if you’d like to see our new content.
We’d like to thank the collaborators who helped us refine the white paper and also the people and partners who helped us test the calculator, as the whole project would not have been possible without them.
* the average is calculated from a range of true values around the minimum effect of interest, e.g. if the minimally desired lift is 0.5 p.p. a range for calculation of -0.5 p.p. to 1.5 p.p. results in a ~52% average savings. 50-60% is an average of the average running times for each of these potential true values and individual mileage will almost certainly vary in both directions
