
(Updated Sep 2022 & Jan 2023 to include updated information about Google Analytics 4)
Many analysts, marketers, product managers, UX and CRO professionals nowadays rely on user counts provided by Google Analytics, Adobe Analytics, or similar tools, in order to perform various statistical analyses. Such analyses may involve the statistical hypothesis tests and estimations part of A/B testing, and may also include regressions and predictive models (LTV, churn, etc.). If you are one of them, brace yourself as this article will reveal some surprising ‘secrets’ about what these user counts really are.
I don’t say ‘secrets’ lightly. Even with many years of experience with Google Analytics I’ve only just recently become aware of what I’m sharing here so ‘secrets’ is, I believe, well-deserved. The implications of the true nature of GA user counts are huge when it comes to using them in A/B tests. Possibly other statistical analyses as well. Oh, and to the extent of my limited understanding Adobe Analytics users seem to not be spared either. So hold onto your hats and let’s dig right in.
The numbers of users shown in Google Analytics are not user counts
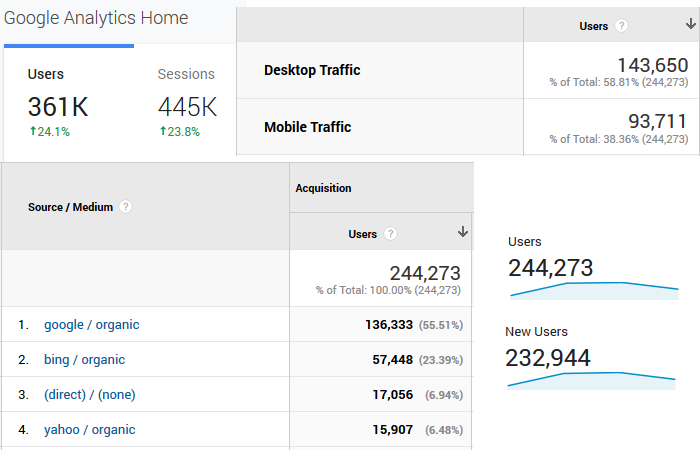
The above is true for an increasing proportion of Universal Analytics users and all Google Analytics 4 users. The number of users displayed in the various Google Analytics reports is not an exact count of the number of users which have been logged as performing actions on a website for any given time frame. To get a bit technical – they do not show the counts of unique cookies / browsers / GA client IDs present in the GA session logs.
Instead, what is shown as numbers of users in these reports is a probabilistic estimate of the true number of users.
This means that the numbers shown are almost inevitably off from the true count by a variable percentage. By design. No matter what one does, if a certain toggle is set to ON (see below), one cannot get a true count in the Google Analytics interface or API. All one gets are approximations.
How can this be?
This fact is mentioned right in the official documentation which has been updated at some point to reflect changes which happened in 2017:
In early 2017, Google Analytics began updating the calculation for the Users and Active Users metrics to more efficiently count users with high accuracy and low error rate (typically less than 2%).
“How users are identified for user metrics”, Analytics Help
This innocent-looking toggle in the Properties settings screen is the way to switch between the previous user number calculation (exact count) and the new one which uses an approximation:
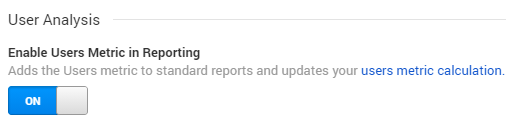
This toggle is turned on by default for new Google Analytics properties (contrary to what the documentation states). It is also something a lot of users have been turning on in the past few years as it provides the much more useful (compared to the other option – Sessions) Users metric in most Analytics reports. The slow trickling of the change in user count processing across the various Google Analytics properties is possibly why barely anyone has taken notice, myself included until very recently.
In the new Google Analytics 4 no option exists to turn off user metrics so every user count you can get through the interface is an estimate instead of an exact count.
The above also means that:
A report without sampling can contain estimates instead of exact counts
In my mind a report with less than 100% sampling was the only situation in which I’d expect to see probabilistic estimates instead of raw counts in GA reports. Less than 100 percent sampling happens when Analytics needs to go through more than 500,000 sessions to generate an ad-hoc report. Predefined reports are notably excluded from this limitation.
As long as I saw the green shield icon I was assured that the data I was seeing consists of exact counts and is therefore accurate to the extent to which it wasn’t affected by any implementation issues and the usual tracking hurdles.
However, this is now only true if the “Enable User Metrics in Reporting” toggle is set to OFF. If it has been set to ON for the property, either manually or by default, the above intuition becomes incorrect as even when sampling 100% of sessions and even in predefined reports the number of users would not be an exact count.
This has significant implications, as shall be demonstrated below. But first, how much accuracy is sacrificed in order to allow for user metrics in reporting?
How accurate are user numbers shown in Analytics?
While the documentation states that the error rate in estimating user counts with the User Analysis toggle ON is typically less than 2%, a more accurate picture can be obtained by knowing more about the algorithm employed by Google Analytics.
Analytics 360 (formerly Google Analytics Premium) is a paid version of Analytics which allows access to the raw data through Google BigQuery. BigQuery allows one to get the exact count of users from raw hit data, or to instruct the engine to use a probabilistic estimate based on the HyperLogLog++ algorithm for cardinality estimation. The numbers extracted using the HyperLogLog++ (HLL++) estimate match the number of users shown in the Analytics user interface. This has been described here by Patryk Buczyński and here as well. The use of HyperLogLog (HLL) has also been confirmed to me in email correspondence by a Google employee privy to the matter.
In the article by Patryk Buczyński above the precision parameter used by Google Analytics has been estimated to be 14. This means it has an accuracy of ±0.41% for 68% of estimates, ±0.81% for 95% of estimates, and ±1.22% for 99% of estimates as stated by the BigQuery documentation. This is equal to the accuracy of HLL initialized with 16-bit registers. A recent update to the GA4 documentation discussed below also states the precision for user counts is set to 14, while the precision for session counts is set to 12.
The above stated accuracy translates to an absolute value of up to 2% relative error for 99% of the estimates, which is exactly the typical error rate limit stated in the Analytics documentation cited above.
To visualize the magnitude of this error, imagine there is a website which receives exactly 200,000 users per day on weekdays and 100,000 users during the weekend. Below is a comparison of what the user trend would look like if these numbers were counted exactly and then how the numbers look with a randomly generated HyperLogLog estimate of the same true count:

A maximum of 2% error for 99% of estimates might not sound like a big deal and it certainly does not look like it on the graph above. As it turns out, this impression is far from correct.
What are the effects on the accuracy of A/B test results?
First, a brief detour on measures of success in online controlled experiments. I’ve argued on more than one occasion that most A/B tests should be based on user-based metrics, ideally Average Revenue per User. Having user-based instead of session-based metrics means that:
- The results are much less ambiguous in interpretation and can have a much greater impact on decision-making.
- Unlike metrics based on sessions or pageviews, user-based metrics are as close as possible to independent observations which is a crucial assumption in many statistical tests, thus promoting statistical validity.
Session-based metrics out of the way, let us take the simplest possible user-based metric: user-based conversion rate of some kind, say user-based subscription rate.
If there are less than 12,000 users per arm in a test, then the statistics will remain largely unaffected since the HyperLogLog++ algorithm achieves superb accuracy at those levels. Things become different above that number of users per test group and get worse the more users there are.
The following are simulation results on the impact of HyperLogLog++ cardinality estimates on the accuracy of the statistical analyses:
| Users per test arm | P-values below 0.05 | α inflation | P-values below 0.01 | α inflation | P-values below 0.001 | α inflation |
| 20,000 | 5.79% | 16% | 1.50% | 50% | 0.17% | 70% |
| 50,000 | 8.75% | 75% | 2.57% | 157% | 0.45% | 350% |
| 100,000 | 11.67% | 133% | 4.39% | 339% | 1.00% | 900% |
| 200,000 | 18.43% | 269% | 8.41% | 741% | 2.76% | 2660% |
| 500,000 | 32.11% | 542% | 19.29% | 1829% | 9.85% | 9750% |
| 1,000,000 | 43.86% | 777% | 31.97% | 3097% | 20.67% | 20570% |
| 5,000,000 | 71.04% | 1320% | 62.49% | 6149% | 53.07% | 52970% |
If there was no impact from HyperLogLog then all numbers in the column “P-values below 0.05” should have been 5% or below, all the numbers in the column “P-values below 0.01” should have been 1% or below, and all the values in column “P-values below 0.001” should have been 0.1% or below. This is far from the case and the discrepancies increase with increasing sample sizes.
The α inflation columns show how big the discrepancy is in percentages. That is, by how much one would be off in their uncertainty estimate simply by virtue of using Google Analytics HLL++ user counts: from 16% to 13x larger uncertainty if the threshold is 0.05 (equivalent to 95% confidence), and from 70% to 530x if the threshold is 0.001 (equivalent to 99.9% confidence).
The following graphs present the same data visually. The six charts are p-value distributions each coming from 10,000 A/A tests. If everything was fine, they should have all contained plots of near-uniform distributions. Instead, note how drastically skewed the distributions become with increasing sample size per arm (cardinality):
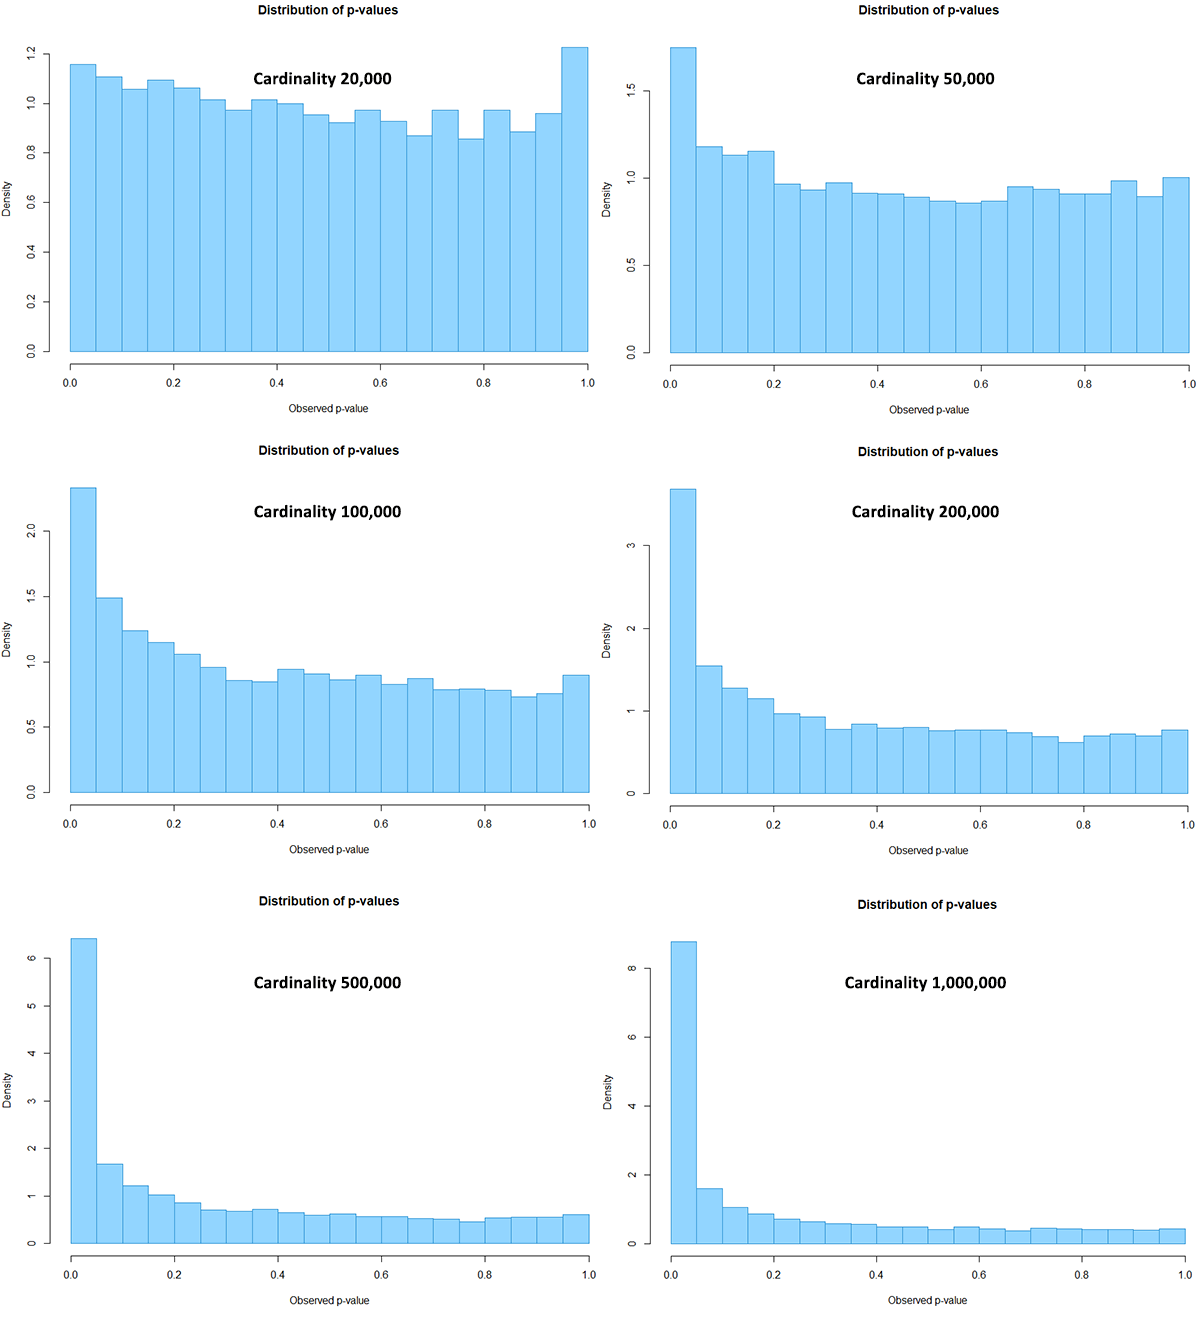
Despite the seemingly innocent 99% error margin of 2% relative error, it has severe effects on the validity of the statistical estimates. A nominal guarantee of 5% type I error rate could end up being an actual rate of 100% with sufficient cardinality. Similarly a 95% confidence interval would have its coverage reduced from the nominal 95% to an actual of 0%. Bayesian estimates would fair no better, and similar effects could possibly apply to other types of statistical analyses.
For comparison, this is equivalent to a very frequent peeking at the results with intent to stop (waiting for significance), but unlike peeking, the effect from HLL++ estimates is virtually unbounded.
The above means that the results from any A/B test with a decent sample size which relies on user-based metrics extracted from a Google Analytics property with the User Analysis toggle switched on are completely compromised.
The same goes for all Google Analytics 4 properties, for which no such toggle even exists.
For a more complete picture of the effects of using HyperLogLog++ and similar cardinality estimates read the whole post.
Given the above, I believe everyone concerned with using Google Analytics data for the purpose of statistical testing and estimation should be interested in getting accurate user counts instead of probabilistic estimates.
Examples of the effect on A/B test outcomes
Here I present a couple of real-world data examples of what using estimates can do with experiment metrics.
| Users in Control Group (HLL) | Users in Control Group (Actual) | Users in Test Group (HLL) | Users in Test Group (Actual) | p-value (HLL) | p-value (Actual) | Test Outcome (HLL) | Test Outcome (Actual) |
| 172,685 | 171,994 | 170,858 | 171,940 | 0.0041 | 0.1295 | Impl. | Reject |
| 174,709 | 172,099 | 170,878 | 171,822 | 0.0185 | 0.8240 | Impl. | Reject |
| 136,592 | 135,891 | 134,685 | 135,591 | 0.0088 | 0.2088 | Impl. | Reject |
| 144,144 | 144,161 | 145,033 | 143,512 | 0.3832 | 0.0408 | Reject | Impl. |
| 144,152 | 143,622 | 145,478 | 144,044 | 0.1983 | 0.0454 | Reject | Impl. |
| 135,151 | 135,688 | 136,374 | 135,802 | 0.1162 | 0.0117 | Reject | Impl. |
In a batch of twenty tests, the six tests above have completely reversed outcomes simply by using exact counts instead of the cardinality estimates offered by Analytics. ‘Impl.’ stands for implementing the intervention. The remaining fourteen did not, but were altered to a smaller extent. Obviously, point estimates and interval estimates would be similarly affected. It should be noted that the first three tests have also failed their SRM checks, while the latter three have not.
The statistical results above are from simple fixed-sample analyses. In practice sequential analyses are often used instead so here are two examples of what that looks like with user count estimates and then with exact user counts (click for full sized images).
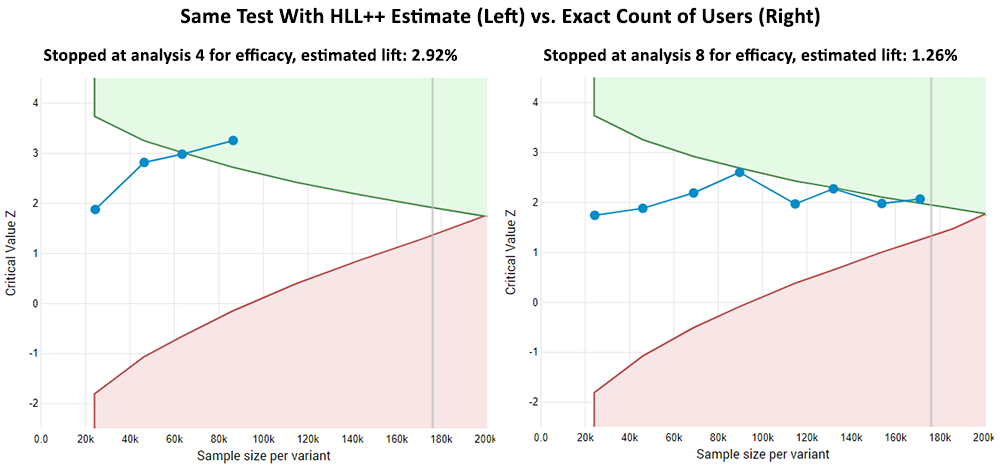
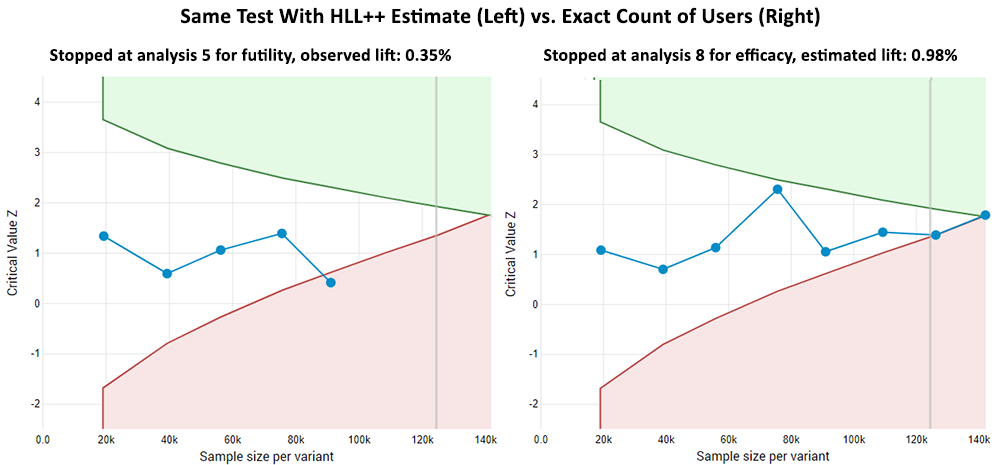
In the first example the test has stopped much earlier with the cardinality estimate data, and though the outcome with the actual data is the same in this case, it came later and the statistical estimates were different due to the higher uncertainty (lower observed and estimated lift, lower p-value, different confidence interval bounds).
In the second example the test stopped earlier and for futility (probability of observing a statistically significant outcome lower than the desired) when using the HLL++ estimates. It stopped at the last possible time with the opposite result and, naturally, different estimates.
While the above data comes from a Universal Analytics account, results should be comparable for Google Analytics 4 since it uses a version of HyperLogLog with comparable precision.
The wider repercussions of replacing user counts with estimates
I am aware of a number of home-grown systems that rely on Google Analytics to store the data they then run statistical analyses on. Some are entirely JavaScript driven while others use server-side systems for delivering the test experiences. Some practitioners might use something like Google Optimize to run the tests and Google Analytics to store the data and then analyze it separately (an approach also suggested by me as an affordable way to run A/B tests).
On top of that, even CRO & UX practitioners who use other systems to conduct experiments and store test data would often supplement the main analysis with an analysis of segments in GA. To the extent that such analyses are performed, they are subject to virtually the same issues.
Furthermore, while this discussion focuses on Google Analytics, other platforms may be using the same or worse cardinality estimation algorithms. For example, Adobe Analytics uses HyperLogLog implemented in such a way that it offers an inaccuracy of up to 5% for 95% of estimates. This would result in far worse results than those for Google Analytics users, and if they are in fact using naked HyperLogLog instead of HyperLogLog++ then even tests with less than 12,000 users per arm might be subject to severe statistical validity issues. If the same systems are used in the Adobe Target A/B testing software the consequences would be even more direct.
The wider consequences of the adoption of cardinality estimates in place of exact counts is that an unknown, but likely quite large number of A/B tests and possibly other statistical analyses conducted with Google Analytics user data over the past couple of years are thoroughly compromised if they are of a decent sample size. The same holds for tests relying on Adobe Analytics data (and possibly Adobe Target data as well).
Depending on the number of decisions informed by such experiments and what was at stake in each case, this could translate to serious cumulative damage. Including the fact that some of the decisions made would have an effect far into the future, as well as continued influence as part of meta analyses and collections of ‘successful’ patterns which would guide future developments, the cumulative potential damages can be multiple times higher than the ones incurred so far.
How to get accurate user counts in Universal Analytics?
In light of all the above, restoring the accuracy of the Google Analytics user numbers is important if these are to be used for any kind of statistical analysis, such as for segmentation for the purpose of A/B testing (e.g. where a custom dimension contains the test ID and variant a user has been assigned to). Unfortunately, this is neither easy nor without some costs.
Here I offer a four-step process for achieving this:
- Step 1: Turn Off the “Enable User Metrics in Reporting” toggle from Admin > Property > Property Settings.
- Step 2: Prepare a Custom Report, type Flat Table, where the first dimension is the one containing the experiment ID and variant ID (e.g. a custom dimension, or the built-in ‘Experiment ID with Variant’ dimension for Optimize experiments). The second dimension should be Browser and the third one Device Category. For metrics choose Users, New Users, and Sessions. Add an Include filter based on the primary dimension so that it matches exactly the experiment ID and variant that you will be pulling data for.
- Step 3: Load the report and select the appropriate date range. From the ‘Show rows’ table dropdown select more rows than the shown row count. On top of the report select Export and then whatever option works best for you (I reckon you wouldn’t want the PDF one).
- Step 4: Open the generated spreadsheet and get the sum of users for each test variant or other segment of interest.

A separate custom report is needed for each segment or test you want to analyze, or you would need to constantly edit the report’s filter settings.
After the above is done the toggle can be switched back ON, until next time. That is, unless the data extraction has been automated using the API (as in our A/B testing calculator) in which case one needs to keep it set to OFF permanently. Playing with the toggle will also not work well if more than one person is accessing the Analytics reports at any given time… Moving the toggle to the view level would seem to resolve a lot of issues, but that is not something any end user can do.
The fact that API extraction is controlled by the same switch by which one controls the UI reporting is the one thing which makes the HyperLogLog issue a major deal even for technically capable teams who are not yet rich enough to afford Analytics 360. The choice is to relinquish User data in the UI in order to retain adequate accuracy by using the API.
Accurate user counts in Google Analytics 4
With Google Analytics 4 just being launched there is now the option to export raw Analytics data to BigQuery, but this obviously comes with its own costs and development resources. On the other hand, there are currently no custom reports in GA4, nor is there a toggle with which the HLL estimate can be switched on or off.
The relevant Google Analytics 4 documentation states that “The method by which Analytics counts users can have a different margin of error for Google Analytics 4 properties than for Universal Analytics Standard/360 properties.” without further details. However, I have it on good authority that the algorithm used is again a version of HyperLogLog and that it has comparable precision to that employed in Universal Analytics.
Jan 2023 update: A month after writing the previous paragraph, the GA4 documentation was augmented with this page, which clearly states HLL is used for user counts and session counts, and the exact precision used, which indeed seems to be exactly the same as in Universal Analytics.
This means that everything in this article should apply equally to Google Analytics 4, and further that to my knowledge there is currently no way to get accurate user counts through the GA4 interface or API.
Takeaways
The number of users shown in any Google Analytics report should not be used for A/B testing statistical analyses if they are above 12,000 users per test group and the property has the ‘Enable User Metrics in Reporting’ set to on since the numbers are then probabilistic estimates instead of exact counts. The inaccuracy introduced from this is up to 2% for 99% of estimates, but even so it is of such size that it has severe negative effects on the validity of any statistical estimates and therefore invalidates any test results.
Depending on the circumstances, the difference between the nominal and the actual error rate, coverage, etc. amounts to many multiples of the former. The more data there is in a test, the worse the statistical estimates become. Things seem to be much worse for Adobe Analytics users.
If you are using Google Analytics users for any kind of A/B tests you need to make sure that raw counts are used instead of the HyperLogLog probabilistic estimates. Unfortunately, getting accurate user counts from Universal Analytics seems unnecessarily difficult for the majority of users. In Google Analytics 4 that is not even an option without an investment into BigQuery. Users of Adobe Analytics and possibly many other software products including ones developed in-house are likely in a similar situation.
About the author

Managing owner of Web Focus and creator of Analytics-toolkit.com, Georgi has over twenty years of experience in online marketing, web analytics, statistics, and design of business experiments for hundreds of websites.
He is the author of the book "Statistical Methods in Online A/B Testing", of white papers on statistical analysis of A/B tests, and has been a speaker at conferences, seminars, and courses. Georgi has been distinguished as a winner in the Data & Analytics category of the 2024 Experimentation Thought Leadership Awards.


Wow, this is huge… I always suspected Users not to be accurate and now it gets confirmed. But what about doing tests on Sessions? I see you mention it a couple of times, but won’t that be an better estimate than flawed user data?
Tnx for letting us all know.
Sessions should be unaffected until you hit sampling. Then both users and sessions are affected, but at least you know that is the case. It is a different kind of inaccuracy and can be absolutely crippling, but I don’t know what sampling methods they use so I cannot offer you a similar analysis on that topic.
The 53X should be actually 530X?
You are, indeed, correct! Just fixed.