
Conversion rate optimization (CRO) encompasses user experience (UX), design, workflow, and other improvements to websites or apps that aim to increase conversions like sales, leads, and others. The major premise put forth is straightforward: reduce friction which improves task completion rates and hence business outcomes. However, trying this in practice quickly reveals how hard it actually is to change user behavior in a measurable way.
WHY that is, however, remains relatively unexplored. I believe I have stumbled upon an underlying reason which seems more prevalent and more consequential than previously thought. It happened while dissecting a case in which a major, unquestionably positive change to a website, failed to impact user behavior.
The article begins with some details on the motivating case, followed by a deeper dive on what that could mean for any kind of CRO project one might be undertaking, and ends with a discussion of possible ways to put that knowledge to work.
Users will go through (almost!) anything to get things done
Often-mentioned things that make CRO & A/B testing hard include:
- the required multi-disciplinary approach
- difficulty in navigating data and statistics, and how to communicate uncertainty
- how becoming data-driven goes against what designers, developers, and managers are used to
- how tough it is to work with low levels of traffic
- the difficulty of prioritizing what to try next
While all of these are true, I think they are just different consequences of an underlying reason I rarely see discussed. The main reason why obtaining results from conversion optimization is difficult is that a motivated user will go through even a miserable user experience to complete a task. Improving the user experience might therefore remove frictions, speed the process up, make it less annoying, or at least make it more pleasing to the eyes. Yet, it may fail to improve the task completion rate. Another way to phrase this is:
If a user has a goal in mind and it seems likely they will achieve it by using your website or app, they can endure more than you’d expect.
Not sure that is the case? Or maybe you think it applies only to certain high-stakes scenarios where motivation is paramount as the user has little choice but to endure? Allow me to present a case study which defies this understanding.
Case study: Switching to a responsive layout in 2026
In 2026 everyone, and not just experts, take for granted that a website should have a fully responsive layout. How well do you think a website without a responsive design would perform? What if I tell you it is in a competitive niche? And what if I add that the information it offers is a commodity available for free since at least the late 2000s? Just move to the next website that offers it and it is right there, for free.
One such website existed in the beginning of 2026 and not only was it doing OK, but it was a leader in its niche. It had a semi-responsive layout which would adjust to screen widths of 650 pixels and above. This leaves virtually all mobile screens showing a version of the website in which text and images are 1.5-2 times smaller than what would be comfortable to read for most. Zooming in, horizontal scrolling, you get the idea.
What changed and the expectation going in
Figure 1 shows a design sketch showing how the website looks on an average width phone screen of 390px. The old version is on the left, and the fully responsive version is on the right. When viewing Figure 1 in full size, font sizes and box sizes are true to how they look on a user’s device (it is not your eyes).
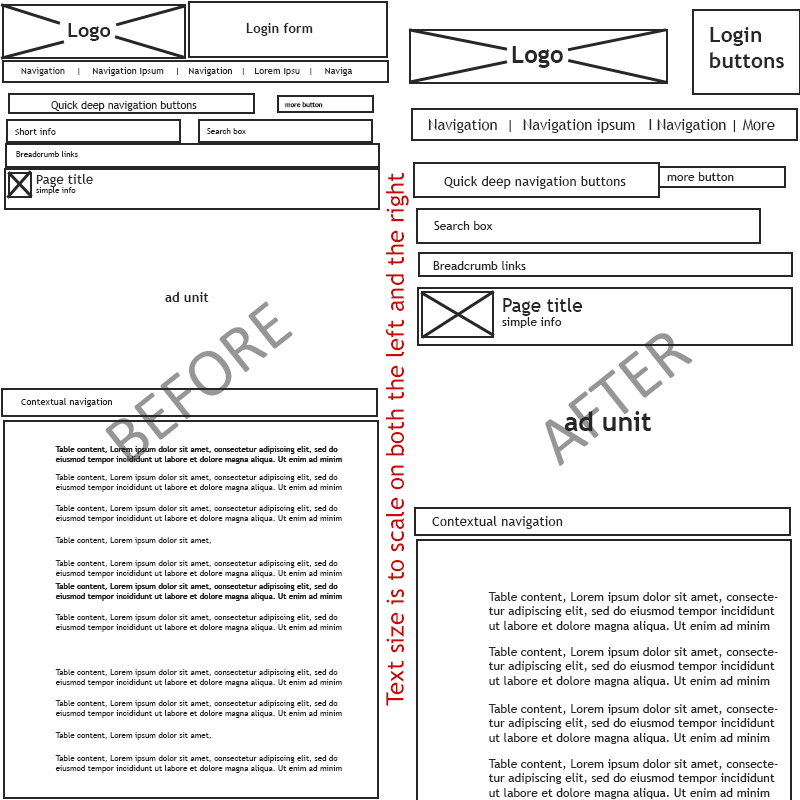
So what we have is a layout that does not adjust to the screen size of at least 99% of mobile devices for the text on screen to be readable. It has to be one the biggest UX blunders imaginable. The hurdle it creates has to be big.
By the logic of “remove significant friction > increase task completion rate”, fixing it should have a great positive effect on user engagement rates for most mobile users. It is not unreasonable to expect that removing that friction is bound to result in at least a modest improvement in, say, engagement rate or views per active user, or both. I surely thought so.
Outcome
However, when the data came in the results were jaw-dropping as it pointed to no net effect from the release of the responsive front-end. Figure 2 shows one would have a very hard time telling anything happened to this website at all. The engagement rate as reported by GA4 is practically the same (adjusted for seasonality) and so is the number of views per active user. This is a publisher website so these metrics are what matter since revenue is quite intimately tied with them, assuming a steady flow of users.
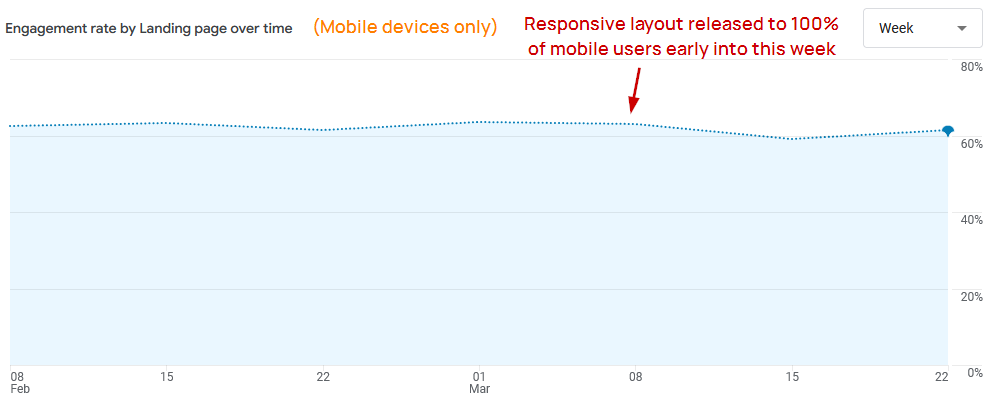
Switching to a fully responsive design had no discernible effect on engagement.
Figure 2 also shows that there is nothing fundamentally broken with the website as it has over 60% engagement rate on mobile devices (and over 75% on desktops). This is not a small or too niche of a website either, averaging about 500K active monthly users who view between 12M and 15M pages per month.
I was just as skeptical of the above as those of you thinking something somewhere must have broken in the responsive version and that it is offsetting any positive effects. However, the data was sliced and diced in every way possible in trying to find a sign of something broken on any respective screen resolution, device brand, geo-location, subsection of the website, and so on and so forth. Nothing was found that would be impacting mobile users negatively as a whole, or any subset of them besides the few minor bugs that were all squashed in the first days following the release.
The question then is:
Why such a big and unquestionable improvement didn’t nudge user behavior?
Not a typical high-motivation case
As hinted above, the reason seems to be user motivation. A well-motivated user would just endure and complete the task at hand. In any behavioral model, a significant hurdle like the lack of responsive design would require very high motivation to overcome in such a decisive way that improving the ease of use would have no effect on engagement rates.
The case study, however, puts that into a different perspective since the website in question does not present a typical high-motivation scenario. In particular:
- It is not a monopoly service.
- Not a high-stakes use case.
- There are no sunk costs going in.
The only thing working towards an expectation of high motivation is the brand value and to an extent, habit. Other factors that should contribute to low expected user motivation and low commitment:
- Negligible switching costs. Usage habits should (in theory) transfer to competitors.
- Ease of access to competitors who are just below in the SERP.
- 40-50% of monthly active users are “New Users” according to GA4
It seems cases of high user motivation like the above may have higher prevalence than current models suggest. Intrigued by this possibility, I’ve constructed a simple mathematical model to help me understand what this could mean for the wider world of conversion optimization.
CRO efforts mostly affect users on the margin
If it is true that many users will jump through hoops to get things done, then what does that mean for the type of efforts characteristic of conversion optimization? To understand this, we have to introduce the concept of a marginal user. Users on the margin are those who may swing between conversion and no conversion, action completion versus no completion, depending on what they encounter on the website or app. In Figure 3 these are the users with either “Some” or “Little” motivation.
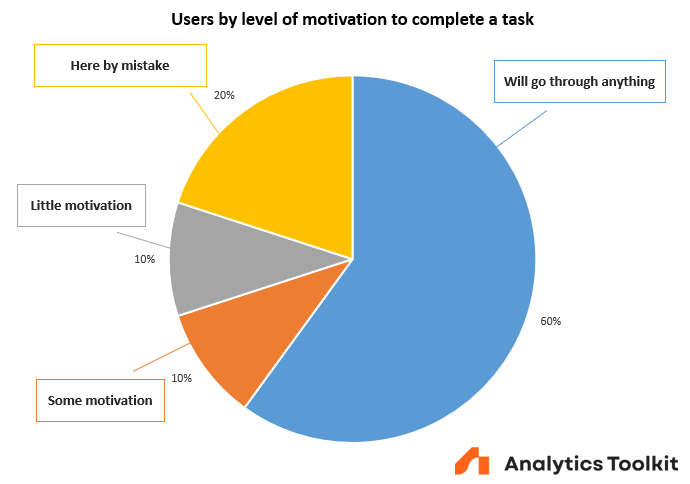
The breakdown from Figure 3 is a partially data-driven attempt to understand the users that enter the website from the case study. Using it for illustrative purposes and exploring what consequences does having a mix of this kind have on the effectiveness of CRO efforts will lead to some powerful insights.
One thing becomes clear immediately: there are at most 20% of users that we have a chance to influence. The 60% that will go through anything but a completely broken experience will not be influenced either way. The 20% who ended there by some kind of mistake such as poor ad targeting, irrelevant organic traffic, or just broad-reaching promotional efforts, will not convert at that time, no matter what. What remains are the other 20%. These are the marginal users that CRO work can typically affect by reducing friction in various ways*.
* when you affect even the most determined users
It goes without saying that breaking the site while trying to improve it can affect even users who would otherwise go through anything, which is why A/B testing as part of risk management should be viewed as part of the deployment process, and not just something you do for CRO-related work.
Some users on the margin will complete the funnel with the current state of things. Others need just a nudge such as a fact stated more clearly, a benefit explained better, an example use case, social proof, or even just a better quality image of the product. Yet others will need significantly more in order to complete the task now, instead of in a week, or to complete it with you instead of a competitor.
Again, the users’ mix by motivation level on Figure 3 is only an illustrative example. The mix for any product or service, or any funnel in them (varies from subtask to subtask), can vary from niche to niche, from brand to brand, from marketing mix to marketing mix, and so on. Changing the mix affects the proportion of marginal users that can be affected by CRO work.
The limits of conversion optimization
Let us examine what such a mix implies about the absolute limit of what CRO can do for a product or service, and by extension about what can be achieved in a single intervention such as the results from a single A/B test.
Assume that nothing is outright broken and so 100% of the highly motivated persons convert. From the marginal users 40% of people with some motivation convert and 20% of the users with little motivation convert. This is illustrated in Figure 4.
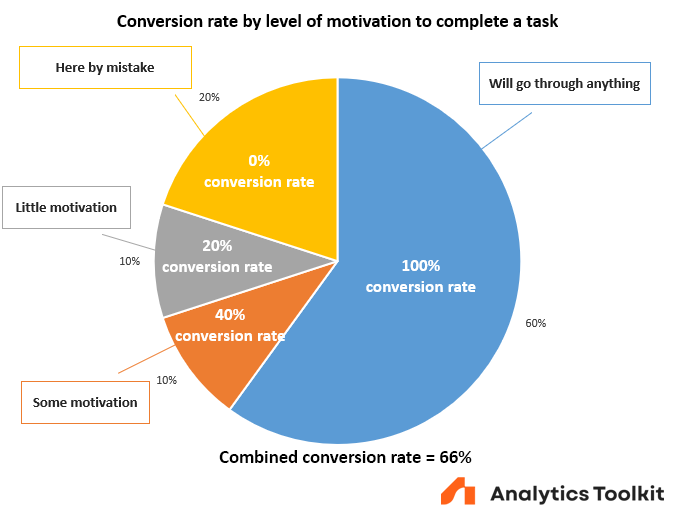
Using straightforward conversion rate math reveals what the total conversion rate would be:
60 p.p. + 40% x 10 p.p. + 20% x 10 p.p. = 60 p.p. + 4 p.p. + 2 p.p. = 66 p.p.
That’s a good 66 percent conversion rate, meaning that two thirds of all who enter that funnel complete the desired action.
Reasonable results for a single change
Continuing the example, if a conversion rate optimization agency or practitioner knows what they are doing, they can probably address one or two of the blockers for these marginal users. Let’s be generous and assume they can implement solutions that reduce the friction for 10% of the users with some motivation who would not otherwise convert, and that it also makes 5% of the users with little motivation convert, who would otherwise fail to do so. What would the combined effect be?
10% x (10 p.p. – 4 p.p.) + 5% x (10 p.p. – 2 p.p.) = 0.6 p.p. + 0.4 p.p. = 1 p.p.
So, with a given well-thought out intervention the agency can increase the conversion rate by 1 p.p.: from 66% to 67%. In relative terms that’s a 1.51% increase. That’s certainly not nothing, but the number is far from those seen in shiny “case studies” some agencies parade around. I’m speaking of the ones featuring double or triple digit increases in conversion rates as outcomes from a single A/B test. These are not impossible per se, but are highly improbable and often fail to convey any kind of statistical uncertainty.
Limit for all possible CRO interventions combined
Assuming that a stellar, hard-working CRO, UX, or product growth team is able to gradually identify and remove all friction for these marginal users, what is the maximum possible improvement they can achieve? Assuming the incoming traffic mix stays the same, the maximum improvement in conversion rate for this funnel is from 66% to 80%. That’s a mere 14 p.p. or a relative improvement of 21%. And that is typically over many months if not years.
For example, if we change the mix so only 10% of users are on the margin the maximum relative improvement possible would be a mere 10%. Or it could be much better, say 40% of users are on the margin, in which case the total possible improvement could reach 54% relative to the baseline.
Remember that these numbers represent the absolute limit of what multiple efforts can achieve cumulatively, assuming there are no significant changes in the user motivation mix.
What this means for Conversion Optimization and UX work
First: the combined, years-long, cumulative efforts of Conversion Optimization practitioners, UX designers, product managers, product growth specialists, copywriters, etc. are all aimed at the marginal users. The actual mix of motivation levels among the users entering a funnel imposes mathematical limits on the maximum possible improvement. These are typically measured in high single digits, low double digits, or in rarer cases high double digits. This is also supported by what is seen in the wild as reported by meta analyses including the outcomes of many online experiments. For example, my extensive meta analysis of 1001 A/B tests reports an average expected effect size of about 2%, while 50% of A/B tests show a negative observed outcome.
The range of expected results should be better understood and communicated internally, in marketing, and to stakeholders, if happy long-term clients are what one is after. This would also ease the psychological difficulty for CROs, designers, and developers. Given how hard it is to nudge users in many cases, it should be expected to see your work often produce no or barely discernible effects. Failing to “deliver results” in a majority of A/B tests is just part of the job, and not necessarily a sign that one is bad at it (the meta analysis supports this, too).
Takeaway number one could be written as:
Don’t overpromise and set realistic expectations internally and externally.
Second, the only way this could be pushed significantly further is if the current state of the website or app is outright broken for certain user segments (devices, screen sizes, geo-location, addresses, payment methods, etc.). In such cases a proportion of highly motivated users (“Will go through anything” on Figure 3) are failing to complete the task.
Using the example mix, if 10% of the highly motivated users are failing due to a particular technical issue, then fixing the issue for them will improve the conversion rate by 6.6 p.p.. That’s probably equivalent to several dozen other interventions combined. However, as the case study above has demonstrated, even that may not be a given.
While I’ve not heard him talk about marginal users, Craig Sullivan from OptimizeOrDie has long advocated that CRO efforts should always begin by fixing broken things (bugs), since there one finds large wins. So comes takeaway two:
Identify and fix what’s outright broken first. It may be the biggest set of “wins” you deliver as a CRO.
Third, the higher the proportion of highly motivated users, the harder it is to deliver large impacts. This goes for any individual tests as well, which is why large sample sizes are required to detect the outcomes of CRO work on many occasions. And the requirements do not increase linearly, but exponentially. That’s how statistical power works.
Accept that you will need to recruit large numbers of users to detect the inherently small effects. That also usually means waiting longer than two weeks, in most cases.
Fourth, under this model, startups and new / small businesses are more likely to achieve higher relative results from CRO expertise and competent product managers. The proportion of marginal users in their funnels is likely to be higher than average for reasons of brand recognition, achieved market fit, lack of user stickiness, and so on. This translates to a larger maximum impact of CRO efforts. Unfortunately, these are often offset by the relatively high fixed-costs, the smaller impacted revenue, and are throttled by smaller sample sizes, which in combination can result in conversion optimization being relatively expensive to engage in early on.
At the task level, take the types of tasks typical for e-commerce websites as an example. The mix likely differs significantly if the funnel starts with an ad landing page and ends with an Add to cart action, versus if it starts with entering the checkout and its completion. The first mix is likely light on high motivation users and heavy on marginal users, whereas those entering the checkout would typically contain a much higher proportion of highly motivated users. The approach used should adjust accordingly.
Finally, the above means that a large brand with a loyal following can probably get away with anything short of the equivalent of a “UX stonewall”. This is also the case where the limit of possible improvements to the baseline is the smallest as a consequence of the proportion of marginal users being so small. The big proportion of users who would endure almost anything is one reason why “enshitification” (aptly coined by Cory Doctorow) is happening to products and services of almost every large brand I can think of.
On the other hand, it also means that curbing an ongoing enshitification process may be the single biggest thing to focus on to deliver CRO results. Even if they mostly come in the form of “we did not lose these users” instead of “we won these additional users”, it is still a win.
Stop enshitification and win in the long-run.
What do you think about the role of user motivation in the results you are seeing from CRO? Is it possible that you have been underestimating it on more than a few occasions? Are you actually testing your user’s resolve to understand just where the optimization “floor” lies for key funnels?
About the author

Managing owner of Web Focus and creator of Analytics-toolkit.com, Georgi has over twenty years of experience in online marketing, web analytics, statistics, and design of business experiments for hundreds of websites.
He is the author of the book "Statistical Methods in Online A/B Testing", of white papers on statistical analysis of A/B tests, and has been a speaker at conferences, seminars, and courses. Georgi has been distinguished as a winner in the Data & Analytics category of the 2024 Experimentation Thought Leadership Awards.

Thanks for the interesting evaluation. This reminds me so much of uplift modeling where the persuadables are a relatively narrow band.