
“Observed power”, “Post hoc Power”, and “Retrospective power” all refer to the statistical power of a statistical significance test to detect a true effect equal to the observed effect. In a broader sense these terms may also describe any power analysis performed after an experiment has completed. Importantly, it is the first, narrower sense that will be used throughout the article.
Here are three typical scenarios of using observed power in online A/B testing and in more general applications of statistical tests:
- An experiment concludes with a statistically non-significant outcome. Observed power is compared to the target power to determine if the test was underpowered. If that is the case it is argued that there is a true effect which remains undetected. This can lead to a larger follow-up experiment or in some cases to extending the experiment until it achieves whatever level of observed power level is deemed sufficient;
- An experiment concludes with a statistically significant outcome, but the observed power is smaller than the target power level of, say, 80% or 90%. This is seen as the test being underpowered and therefore questionable or outright unreliable;
- An experiment concludes with a statistically significant outcome, but the observed effect size is lower than the target MDE (minimum detectable effect), and that is seen as cause for concern for its trustworthiness;
While these might seem reasonable, there are unsurmountable issues in using post hoc power. These have been covered with increasing frequency in the scientific literature [1][2][3][4][5], yet the problem persists in statistical practice.
This article takes certain novel approaches to debunking observed power, including using a post hoc power calculator as an educational device. Through a comprehensive examination of the rationale behind observed power all possible use cases are shown to rest on valid, but unsound chains of reasoning, which might explain their surface appeal.
This and the two companion articles further explore the different harms caused by using observed power in scenarios readers should find familiar, in a uniquely comprehensive manner.
Table of Contents:
- Observed power as a proxy for true power
1.1. High true power is not a requirement for a good test
1.2. Observed power as an estimate of true power - Viewing the power level as a threshold to be met
2.1. Low observed power does not mean a test is underpowered - Observed power is a direct product of the p-value
3.1. Post hoc power calculator - Observed power with a non-significant outcome
4.1. Does peeking through observed power inflate the false positive rate? - Observed power with a statistically significant outcome?
5.1. MDE as a threshold
5.2. Viewing the observed effect size as the one a test’s conclusion is about - All power is propter hoc power
- Takeaways
Observed power as a proxy for true power
A major line of reasoning behind the use of observed power is what may be called “the search for true power”.
The logic of searching for “true power”* goes like this:
- “Good” or “trustworthy” statistical tests should have high “true power”: high probability of detecting the true effect, whatever it may be;
- The true effect size is unknown and there is often little data to produce good pre-test predictions about where it lies;
- Post data, the observed effect (or an appropriate point estimate), is our best guess for the true effect size;
- Substituting the true effect for the observed effect in a power calculation should result in a good estimate of the “true power” of a test.
These premises lead to the following conclusion:
To ensure a test is “good” or “trustworthy”, aim to achieve high power versus the observed effect as the best proxy for the true statistical power of the test.
While the above is a valid argument for using observed power, it is not a sound one since premises one and four can be shown to be false.
* side remark on “true power”
The focus some people have on “true power” may stem from poor and incomplete definitions of power found in multiple textbooks and articles. Namely, one can often see power described as “the probability of finding an effect, if there is one”. However, this is a misleading definition since it skips the all important ” of a given size” instead of the easily assumed “of any size”. Such a confusion result may lead to searches of “true power” instead of acceptance of its hypothetical nature. Compare the above shorthand to the definition given in “Statistical Methods in Online A/B Testing”: “The statistical power of a statistical test is defined as the probability of observing a p-value statistically significant at a certain threshold α if a true effect of a certain magnitude μ1 is in fact present.[…]”
High true power is not a requirement for a good test
When planning an A/B test or another type of experiment, one often does not know the true effect size and may have very limited information to make predictions about where it may lie. Planning a test with a primary motivation of achieving a high true power results in committing to as large a sample size as practically achievable and in choosing as low a significance threshold as possible. This would maximize the chance of detecting even tiny true effects.
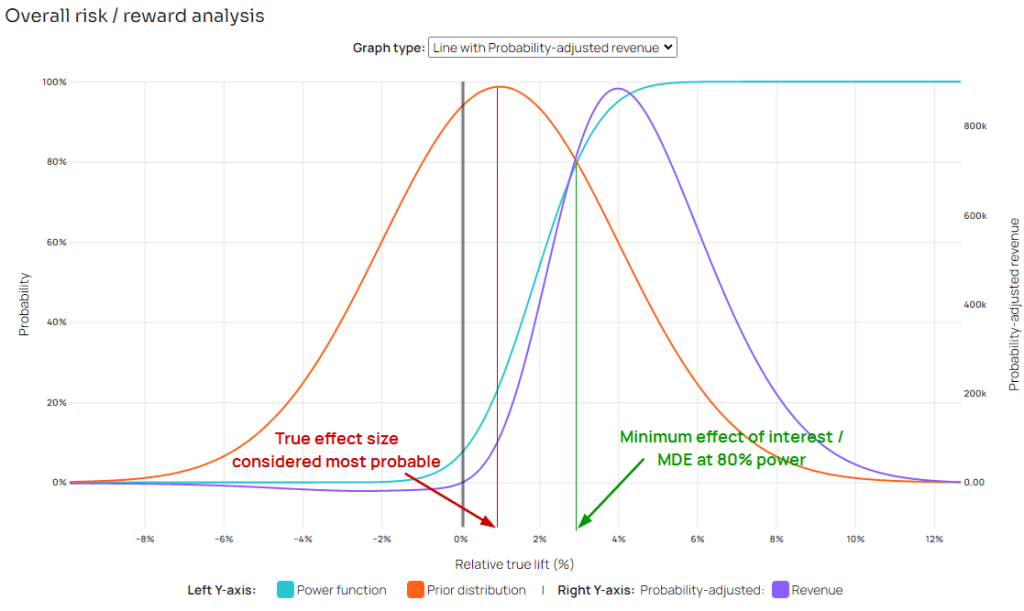
However, such an approach would ignore the trade-offs between running a test for longer / with more users, and the potential benefits that may be realized (for details see “Statistical Power, MDE, and Designing Statistical Tests”, risk-reward analysis and its references). True effects below a given value are simply not worth pursuing due to the risks of running the test no longer being justified by the potential benefits.
The pivotal value where that happens is called a minimum detectable effect (MDE) or a minimum effect of interest (MEI). It is the smallest effect size one wants to detect with high probability, where “detect” means a statistically significant outcome at a specified significance threshold. It is the smallest effect size one would not want to miss. Aiming for high power for any value below the MEI would, by definition, achieve poorer business outcomes from A/B testing.
Even if it is almost sure what the true effect size is, it would rarely match the minimum effect of interest. The framework for choosing optimal sample sizes and significance thresholds deployed at Analytics Toolkit’s A/B testing hub often arrives at optimal parameters under which the MDE (at a high power level such as 80% or 90%) is larger than the expected effect size. This decision framework is most fully explained in the relevant chapter of “Statistical Methods in Online A/B Testing”.
Finally, it should be noted that taking premise one as given and aiming for high true power would turn the planning phase of an experiment into an exercise of guessing what the true effect of an intervention is. The logical conclusion of “the search for true power” renders all pre-test power analyses and test planning futile. However, good planning is what ensures an experiment, be it an online A/B test or a scientific experiment, offers a good balance between the expected business risks and rewards.
Rewriting premise one to make it true would result in:
- “Good” statistical tests should have high power to detect the minimum effect of interest.
Since the minimum effect of interest is rarely the true effect size, the above statement breaks the rest of the argument and makes it unsound. The search for true power is therefore illogical and it does not justify the use of observed power. This holds even if observed power was a good estimate of true power. Whether that is the case is explored in the following section.
Observed power as an estimate of true power
Another reason why searching for true power is not a logical justification for using observed power is that the fourth premise does not hold either. Namely, the observed power of a test is a poor estimate of its true power. To be a proper estimator of true power, observed power should ideally be all of the following:
Some of these conditions can be relaxed in complex modeling problems where an ideal estimator either does not exist or has not yet been found. However, observed power performs really poorly on all accounts:
- It does not hone in on the true value with larger amounts of information; (is not consistent)
- Observed power is almost always heavily biased vis-à-vis true power;
- There is no reason to suspect it is a sufficient statistic of true power;
- Its variance is far too large to be useful (even if it somehow turns out to be efficient though biased)
Yuan & Maxwell end their work titled “On the Post Hoc Power in Testing Mean Differences”[6] with the following assessment:
“Using analytical, numerical, and Monte Carlo approaches, our results show that the estimated power does not provide useful information when the true power is small. It is almost always a biased estimator of the true power. The bias can be negative or positive. Large sample size alone does not guarantee the post hoc power to be a good estimator of the true power.”
I’ve conducted some R simulations of my own to visualize how poorly observed power behaves as an estimate of true power:
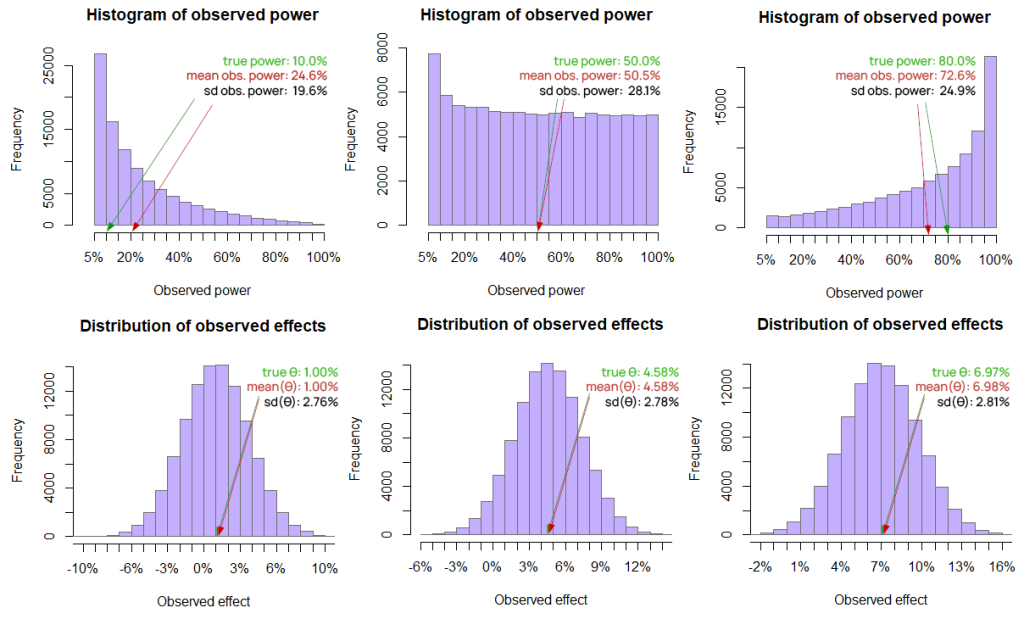
All three simulations have 100,000 runs and share the same properties except for the different true effect and hence true power. Histograms in each column come from the same simulation and offer a direct comparison which reveals just how poorly observed power does as an estimate compared to the observed effect size which in this case is the MLE. In short, it has inconsistent variance, the bias is obvious, and consistency is obviously non-existent.
Viewing the power level as a threshold to be met
Another error shared by different use-cases of observed power is to view the choice of statistical power level (1 – β) and its complement, the type II error rate β, as being in the same category as the choice of the significance threshold α and the resulting type I error rate. The logic is as follows:
- The test’s chosen power level is 80% (or 90%, etc.) against a given effect size of interest;
- The pre-test power level is a threshold which should be met for the outcome to be considered trustworthy;
- The observed power is what needs to be compared to the target power level to ensure said threshold is met;
Naturally, the conclusion is that:
If the observed power is lower than the power level , then the test is underpowered as it has failed to achieve its statistical power threshold / target type II error rate.
The above logic is unsound due to issues with premises two and three. Regarding premise two, the test’s target power level is not a cut-off that needs to be met by any statistic of the observed data in order to declare or conclude something. The power level and the type II error rate are inherently pre-data probabilities. The level of statistical power against a chosen MDE (MEI) is achieved by the experiment reaching (or exceeding) the sample size determined to be necessary by way of a pre-test power analysis *.
* the obvious exception
The only exception to this may be when the observed variance of the outcome measure is meaningfully different from the variance used in the power analysis and sample size calculations. For example, the base rate of a binomial variable may turn out to be significantly lower than expected, in which case the analysis may need to be rerun and a new sample size may need to be calculated. In e-commerce this may happen if seasonality or a significant change in the advertising strategy cause a sudden influx of prospective customers who are less qualified or less willing to purchase than previous ones, among other reasons. Even when that happens to be the case, only the observed variance may play a role in this sample size recalculation, not the observed effect size, so one cannot speak of observed power in the sense defined at the beginning paragraph of this article.
Once an experiment reaches its target sample size it has achieved its desired statistical power level against the minimum effect of interest regardless of the outcome and any other statistic.
Regarding premise three, it would be useful to point out that the significance threshold α is a cut-off set for the p-value. The p-value is a post-data summary of the data showing how likely (or unlikely) it would have been to observe said data under a specified null hypothesis. The significance threshold applies directly to the observed p-value and leads to different conclusions like “reject the null hypothesis” or “fail to reject the null hypothesis”.
The target level of statistical power is not a cut-off in the same way and there is no equivalent to the p-value for statistical power. Observed power surely cannot perform the function of the p-value since power calculations do not use any of the data obtained from an experiment. Making the hypothetical true effect equal to the observed effect does not make the power calculation any more informative.
Low observed power does not mean a test is underpowered
As a consequence of the above, a test cannot be said to be underpowered based on the observed power being lower than the target power (see Underpowered A/B Tests – Confusions, Myths, and Reality). A test has either reached its target sample size or not and observed power cannot tell us anything about that. In this light both “observed power” and “post-hoc power” are bordering on being misnomers. More on this point in the last section of this article.
Observed power is a direct product of the p-value
To some, the fact that observed power can be computed as a direct transformation of the p-value is the nail in the coffin of the concept. However, this has been known since at least Hoenig & Heisey’s 2001[1] article in The American Statistician. Yet, fallacies related to observed power persist. This is why I have tackled some of the logical issues with its application before turning to this obvious point.
What is meant by a direct product? Given any p-value p from a given test of size α, the observed power can be computed analytically using the following equation[1]:
GZp(α) = 1 − Φ(Zα − Zp)
Where Φ is the standard normal cumulative distribution function, Zα and Zp being the z-scores corresponding to the significance threshold and the p-value, respectively. Observed power is therefore determined completely by the p value and the chosen significance threshold. In other words, once the p-value is known, there is nothing that calculating observed power can add to the picture.
Post hoc power calculator
To illustrate this, I’ve built a simple post hoc power calculator which you can use by entering your significance threshold and the observed p-value. The level of statistical power against the observed effect will be computed instantaneously, and you can explore the relationship of any p-value and the post hoc power it results in by hovering over the graph.
The green vertical line represents the significance threshold, whereas the violet line is the observed p-value. Feel free to test it against some of your own, independent calculations of statistical power.
The interesting question is what follows from the fact that the observed power is a simple transformation of the p-value? The answer is broken down below by whether the outcome is statistically significant or not.
Observed power with a non-significant outcome
When using observed power with non-significant test outcomes, it is virtually guaranteed to label such tests as “underpowered”. This is due to the conflation between low true power and a test being underpowered, coupled with the misguided belief that “observed power” is a good estimate for “true power”. These have been debunked in earlier sections.
To compound the issue, the maximum observed power possible with a non-significant outcome is below 0.5 (50%) at any given significance threshold. Examine the fraction of the observed power curve which spans the non-significant outcomes:
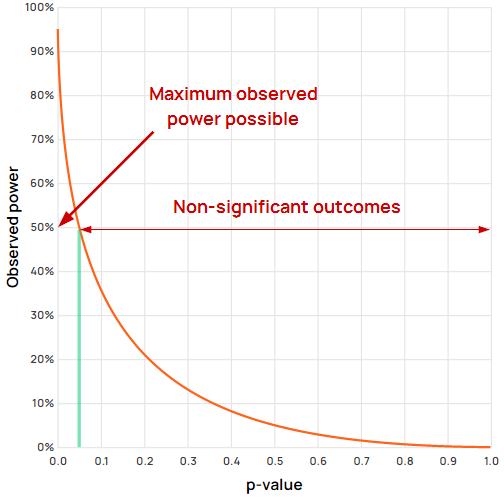
For all non-significant values the power is lower than 50%. In this example a threshold of significance of 0.05 is used, but you can use the post-hoc power calculator above to check that it is the case by entering different thresholds.
In a best case scenario, an observed power of 50% or lower would be interpreted as the test being underpowered which can be used to justify a follow-up test with significantly larger sample size / longer duration.
There is also a contradiction with the p-value. As evident from Figure 3, the smaller the p-value, the higher the observed power is. Interpreting higher observed power as offering stronger evidence for the null hypothesis directly contradicts the logic of p-values in which a smaller p-value offers stronger grounds for rejecting the null hypothesis, not weaker.
In the worst possible scenario, low observed power is taken as a grant to continue the test until a given higher sample size is achieved:
Does peeking through observed power inflate the false positive rate?
Peeking through observed power, a.k.a. “fishing for high observer power”, is bound to lead to a higher false positive rate than what’s nominally targeted and reported. As shown in the simulations in “Using observed power in online A/B tests”, continuing an experiment after seeing a non-significant outcome coupled (inevitably) with low power until a significant outcome is observed or for as long as practically possible leads to around 2.4x inflation of the type I error rate.
Changing some of the necessary assumptions may lower the actual type I error rate to “just” being two-fold higher than the nominal one. The actual rate can be threefold the nominal under less favorable assumptions. In all cases the increase is far outside what is typically tolerable.
Observed power with a statistically significant outcome?
Given that statistical power relates to type II errors and the false negative rate, it might seem contradictory to even look at statistical power after a test has produced a statistically significant outcome. With a significant result in hand there remains only one error possible: that of a false positive and not of a false negative.
Further, power is a pre-test probability, just like the odds of any particular person winning a lottery draw are. When someone wins the lottery it is illogical to point to their low odds of winning as a reason to reject giving them the prize. These odds are irrelevant once the outcome has been realized. It is similarly illogical to point to a low probability of observing a statistically significant outcome as an argument against the outcome being valid after it has already been observed. This is regardless if the power analysis focuses on observed power or not.
As a practical matter, requiring an outcome to be both statistically significant and to have observed power higher than the target level results in an actual error control which is multiple times more stringent than the nominally targeted level.
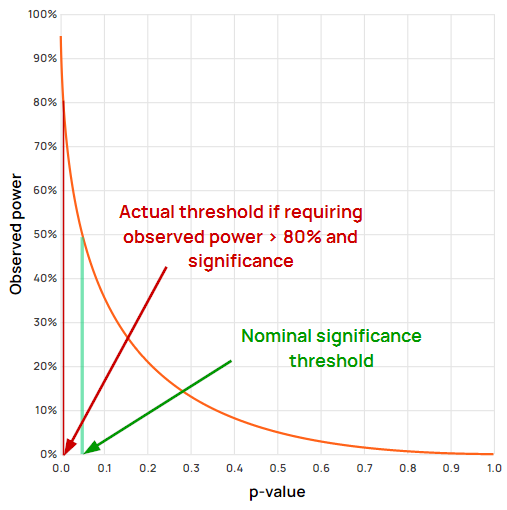
Figure 4 demonstrates visually that the high observed power requirement completely overrides the significance threshold, making it redundant. That is because p-values below 0.006 would be disregarded by the requirement for low post hoc power, whereas the significance threshold is at 0.05.
Knowing the above it may seem unfathomable that someone may insist on the utility of observed power even when presented with a statistically significant outcome. The already discussed “search for true power” and viewing the chosen power level as a threshold can explain a lot of the motivation behind the misguided use of observed power in ensuring the trustworthiness of even statistically significant tests.
However, there are two more to consider:
MDE as a threshold
Another angle through which misunderstandings about statistical power make it into A/B testing practice is when the question of a test being underpowered is framed in terms of the minimum detectable effect (MDE). Namely, it is seen as an issue if the observed effect size is smaller than the MDE, especially if the outcome is statistically significant.
The numerous misunderstandings regarding the relationship (or lack thereof), as well as the harms which follow are explored in What if the observed effect is smaller than the MDE?. In short, the outcome of requiring significant results to also have an observed effect greater than the MDE are exactly the same as when requiring high observed power.
Viewing the observed effect size as the one a test’s conclusion is about
From a slightly peculiar angle, observed power may be invoked with significant outcomes due to a warranted skepticism regarding an observed effect that seems “too good to be true” especially if it is coupled with a low p-value. The misunderstanding here is a common one related to p-values. Through its lens, p-values are viewed as giving the probability that the observed effect is due to chance alone. p-values, however, reflect the probability of obtaining an effect as large as the observed, or larger, assuming a data-generating mechanism in which the null hypothesis is true. Given the role of the null hypothesis in hypothesis testing, it is obvious that the p-value attaches to the test procedure and not to any given hypothesis, be it the null or alternative. P-values do not speak directly of the probability of the observed effect being genuine or not.
If influenced by the above misconception, some might be skeptical upon seeing an effect that seems too good to be true accompanied by a p-value which seems too reassuring. Given the incorrect interpretation of what the statistics mean, such skepticism is warranted, but observed power is not the correct way to address it.
A post hoc power calculation makes no use of the test data and is therefore unable to add anything to the observed p-value. Instead, the uncertainty surrounding a point estimate can be conveyed through confidence intervals at different levels, or in terms of severity (as in D. Mayo’s works) for any effect of interest.
All power is propter hoc power
In some sense, it can be argued that it is a misnomer to speak of “Observed power”, “Post hoc Power”, or “Retrospective power”. No formula or code for computing statistical power and has a reference to anything observed in the experiment. The reason is that statistical power calculations are inherently pre-data probabilities and so the statistical power function / power curve is computed using pre-data information.
Examining any particular value of that function after an experiment is the same as if done beforehand since the entire power curve is constructed without any reference to observed test data.
Statistical power is inherently a pre-data probability. It does not use any of the data from a controlled experiment. As result, the power level for any hypothetical true effect can be computed before any data has been gathered.
Maybe the term “post hoc power analysis” has some merit in that it is a power analysis performed after the fact on the timeline, but given the other possible meanings just calling it a “power analysis” would avoid many of the problems and misunderstandings associated with attaching a “post hoc” or “retrospective” qualifier to “power”.
Takeaways
All possible justifications for the use of observed power rest on unsound arguments and stem from misunderstanding of one or more statistical concepts. To recap:
- High true power is not necessary for a test to be well-powered, and even if it were, observed power is not a good estimate of true power
- Neither the target power level nor the target MDE are thresholds to be met by any observed statistic (“observed” power or observed effect size respectively being the common choices)
- Non-significant outcomes always appear underpowered if the observed power level is compared to the target power level
- Requiring high post hoc power for significant outcomes is equivalent to drastically increasing the significance threshold of the test, and so is requiring the observed effect size to be greater than or equal to the target MDE (as the two are equivalent)
- Statistical power is a pre-test probability, regardless of when it is computed, and it does not use the test data
At best, observed power is unnecessary given a p-value has been calculated as it has direct functional relationship to it. Enter a p-value and a threshold and the post-hoc power calculator will output the observed power.
At worst, using observed power may lead to all kinds of issues, including:
- mislabeling well-powered tests as either underpowered or overpowered ones
- identifying trustworthy results as untrustworthy
- peeking through observed power, resulting in a significantly inflated type I error rate
- greatly raising the bar for significance in a non-obvious manner (when required with significant outcomes)
- unjustifiably extending the duration and increasing the sample sizes of A/B tests by orders of magnitude
Given the above, Deborah Mayo’s term “shpower” is spot on when describing observed power, defined as the level of statistical power to detect a true effect equal to the observed one. One should be able to guess what two words “shpower” is derived from, even if English is not your native language.
References
1 Hoenig, J. M., Heisey, D. M. (2001) “The abuse of power: The pervasive fallacy of power calculations for data analysis.” The American Statistician, 55, 19-24.
2 Lakens, D. (2014) “Observed power, and what to do if your editor asks for post-hoc power analyses”, online at https://daniellakens.blogspot.com/2014/12/observed-power-and-what-to-do-if-your.html
3 Zhang et al. (2019) “Post hoc power analysis: is it an informative and meaningful analysis?” General Psychiatry 32(4):e100069
4 Christogiannis et al. (2022) “The self-fulfilling prophecy of post-hoc power calculations” American Journal of Orthodontics and Dentofacial Orthopedics 161:315-7
5 Heckman, M.G., Davis III, J.M., Crowson, C.S. (2022) “Post Hoc Power Calculations: An Inappropriate Method for Interpreting the Findings of a Research Study” The Journal of Rheumatology 49(8), 867-870
6 Yuan, K.-H., Maxwell, S. (2005) “On the Post Hoc Power in Testing Mean Differences” Journal of Educational and Behavioral Statistics, 30(2), 141–167.
About the author

Managing owner of Web Focus and creator of Analytics-toolkit.com, Georgi has over twenty years of experience in online marketing, web analytics, statistics, and design of business experiments for hundreds of websites.
He is the author of the book "Statistical Methods in Online A/B Testing", of white papers on statistical analysis of A/B tests, and has been a speaker at conferences, seminars, and courses. Georgi has been distinguished as a winner in the Data & Analytics category of the 2024 Experimentation Thought Leadership Awards.

