Several charges are commonly thrown at A/B testing while considering it or even after it has become standard practice in a company. They may come from product teams, designers, developers, or management, and can be summed up like this:
- A/B testing stifles innovation by rejecting too many good ideas
- it is wasteful and a “drag”, unnecessarily delaying deployment of changes and new features
- the total impact of experimentation on the bottom line is difficult to estimate, so its added value is unclear
A good way to address these and to make the business case for experimentation is to compare the growth paths and outcomes of a company with and without A/B testing. This article explores the business value of A/B testing through extensive simulations of these two approaches. The validity of the charges against experimentation are addressed and explored under varied assumptions about the ability of a company to come up with ideas and implement changes, as well as the available sample sizes. Also included is a comparison between the performance of testing with proper statistical methods versus a naïve approach in which one simply picks what looks better based on the observed effect.
The results show experimentation causes a dramatic improvement in the growth paths and the expected outcomes of companies when compared with deployment without testing. All other things equal, it should result in a highly competitive return on investment. The above holds to varying degrees regardless of how good or bad a company is in coming up with ideas and implementing them. No matter how exceptional the business, it will still likely benefit from employing A/B testing. Even naïve experimentation with minimal statistical rigor is way better than not A/B testing at all, but statistical rigor makes actionable learnings and incremental improvements more likely.
Table of contents:
- Product Development With Testing vs Without
- Simulation Results on the Value of Experimentation
- Better Than Average True Effects
- Worse Than Average True Effects
- A/B Testing for Small Companies & Startups
- Addressing the Criticisms of Experimentation
- Important caveats
- Takeaways
Product Development With Testing vs Without
Imagine three fictitious companies: “ShipFastt Inc.”, “ShipSimple Inc.” and “ShipCareful Inc.”. They are completely the same in every regard, except for their approach to shipping (implementing) changes. Importantly, all three are equally good at:
- coming up with ideas for changes to existing products and functionalities, as well as ideas for new functionalities or products
- implementing these ideas in reality, bug-free or otherwise
- deploying and supporting the implementations over time
Where they differ is in their approach to managing business risk:
- ShipFastt does not care at all about risk or has subscribed to the above criticism of A/B testing and so is eager to ship changes as fast as possible without any testing whatsoever.
- ShipSimple performs experiments for every change, but is happy to just ship whatever shows a positive outcome after a reasonable sample size is achieved.
- ShipCareful also A/B tests every change, but employs a relatively conservative statistical significance threshold to screen what changes to deploy (the “textbook” 0.05 significance threshold).
Simulation assumptions
The simulations presented below show what happens to each of these otherwise identical companies as result of their use of A/B testing (or lack thereof) by following them for 40 time slices and for up to 40 change deployments. You can imagine a time slice to be two weeks long, or one month long, or some other time frame, but it ultimately does not matter for the comparison, as long as they are equal for all companies.
ShipFastt ships immediately and is therefore able to deploy a change at every time slice. Let us assume that the two companies which test take twice as long to deploy due to the time necessary for the A/B tests to run until they achieve a decent sample size, as well as decent outcome generalizability. This means that in 40 time slices ShipSimple and ShipCareful are only able to deploy 20 changes and are therefore significantly slower than ShipFastt.
For the companies that do experiment, assume they are able to dedicate an average of 500,000 users per A/B test, or 250,000 users per test variant in the most common scenario of testing one variant against a control. This average is based on meta-analytical data from thousands of real-world experiments. Other sample sizes will be explored as well.
Finally, assume that all companies are about as good at coming up with and implementing ideas as the better part of the conversion rate optimization professionals. In particular, the distribution of the achieved true effects looks like this:
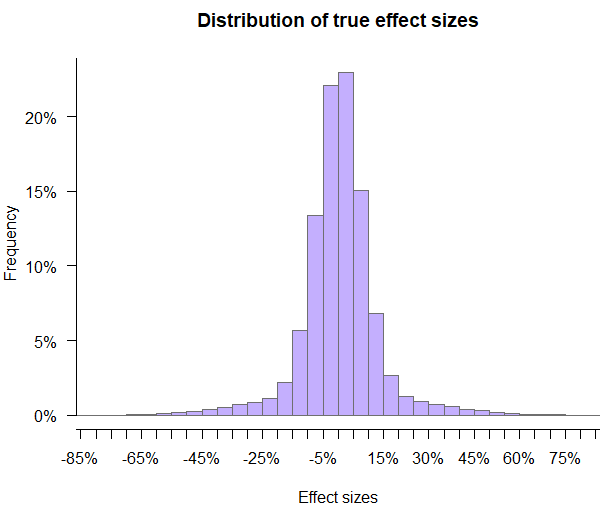
The distribution of true effects on Figure 1 are close to what was observed in a meta analysis of 1001 A/B tests and also aligns closely with data from a private meta analysis based on a much larger number of tests. The distribution is fat-tailed with a mean of 0.5% and a standard deviation of around 13.25%. Other scenarios are covered in the sections to follow.
For all simulations the starting conversion rate is 5%, making simulations tractable and results presentable, but the outcomes should generalize to any rate or revenue metric (such as ARPU) with small caveats.
Example simulation runs
Here is an example simulation run for each of the three companies, which should help understand how the simulations work.
First, Figure 2 shows an example growth path for ShipFastt which does not perform any experiments. There are ups and downs, sometimes one after another, sometimes separated apart. The path is more or less a random walk with a slight positive drift due to the positive mean of the distribution of true effects.
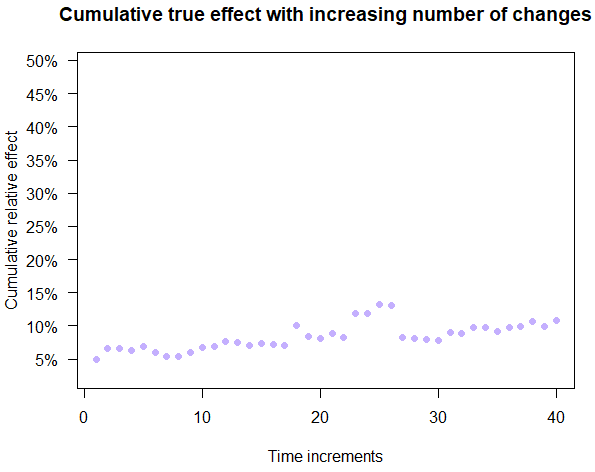
Figure 3 shows an example of the rigorous testing path and the simple testing path overlapping. These are often very similar, especially with large sample sizes.
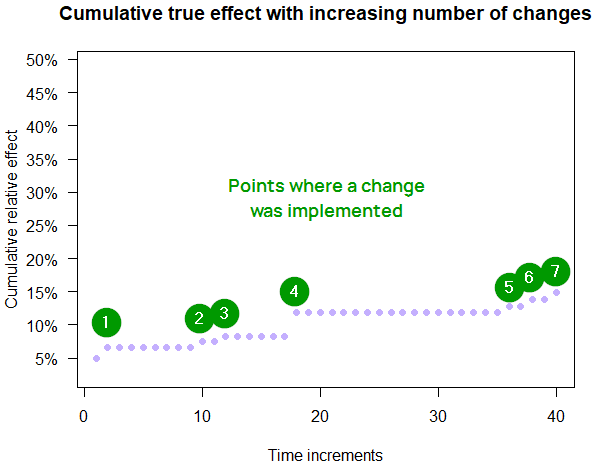
Both Figure 2 and Figure 3 growth paths are from the same simulation run, meaning that the same true effects were experienced by each company at each time slice. In light of this it is immediately noticeable that there are no downward moves for the path shared by ShipCareful and ShipSimple in this example. Setbacks are possible and they do happen in other simulation runs even with ShipCareful. Setbacks are several times more likely for ShipSimple, as will be shown in subsequent sections.
Note that for both ShipSimple and ShipCareful every second time increment is skipped (value left unchanged) to reflect the fact that they need to spend time testing, instead of deploying the next change. In reality half of the users would be experiencing a new variant, thus being influenced up or down, but with symmetrical effect distributions near zero those half-shifts will cancel each other out.
The above assumes the changes affect the same process or functionality and it is not possible to work on them in parallel (though there is nothing wrong with running A/B tests in parallel, on the same audience).
Simulation Results on the Value of Experimentation
In this run it is assumed that the ideas and implementation for all three companies are right about average. There are some good ones and some bad ones with many having barely any impact either way, maybe because the product is already somewhat refined and it is somewhat difficult to significantly improve on it. With the default parameters, there are a couple of ways to examine the outcomes.
First, the growth paths experienced by each company can be plotted. The paths for ShipFastt are shown on Figure 4 and it is notable that there are a number of paths that end up with negative outcomes, with some dropping below the starting 5% rate very early on. A notable amount of outliers is noticeable at later stages.
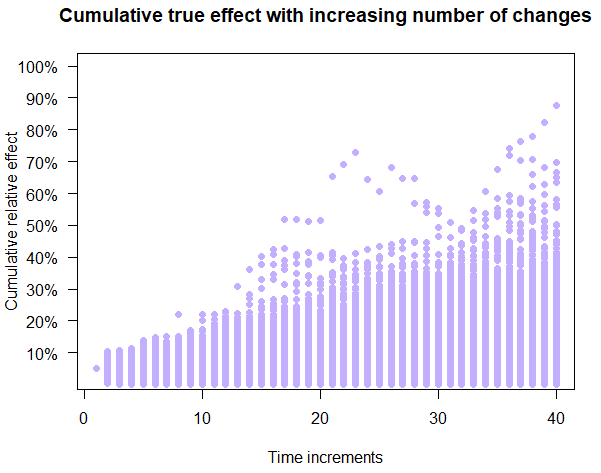
Compare the relatively inconsistent and sometimes negative outcomes from Figure 4 to those shown on Figure 5. Figure 5 depicts the outcomes of the ShipSimple company which experiments, but with more basic statistical analyses.
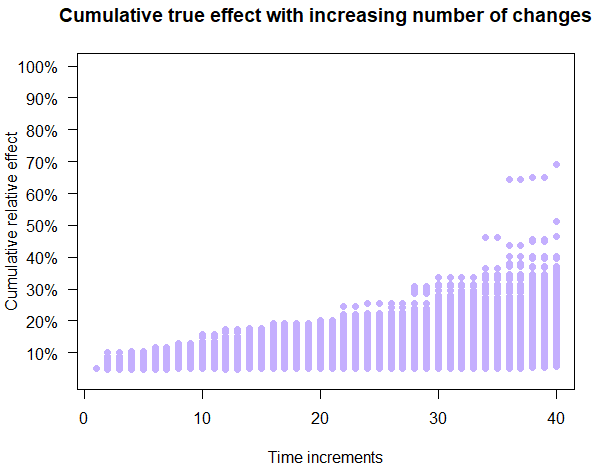
The relatively high sample size and the randomized controlled nature of experiments ensure that one very rarely implements harmful treatments. There is also a notably consistent cumulative growth over time.
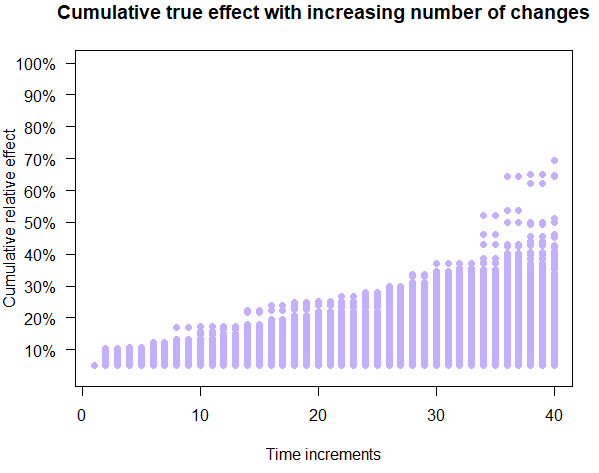
The picture is very similar for ShipCareful (Figure 6) where low statistical uncertainty is required before implementing anything: consistent outcomes with steady growth and virtually no negative cumulative outcomes at any point in time.
Cumulative outcomes
While the plots on figures 4, 5, and 6 are good at showing progress over time, they are not ideal for fully appreciating the differences between the three approaches due to the fact that most points overlap each other.
A better way to visualize the outcomes is to look at where each company ended up after all forty time periods. The comparison of the distributions of these outcomes on Figure 7 (click it for full size) makes it clear that ShipSimple and ShipCareful have very similar probabilistic outcomes and they are distinctly better than those of the ShipFastt company.
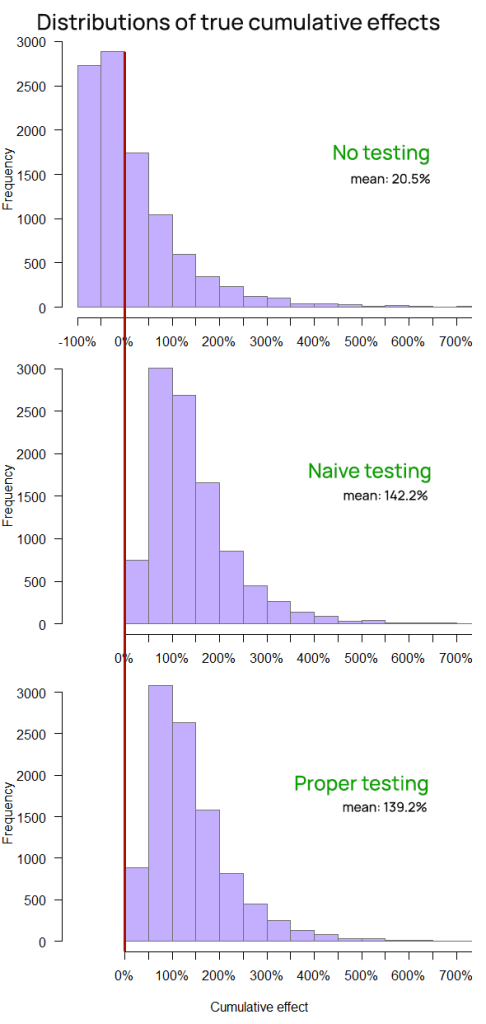
While all three companies achieve on average a positive cumulative outcome, it is notable that the chance of ShipFastt of ending up with a significant decrease in their key business metric (e.g. revenue) is infinitely higher than that of ShipSimple and ShipCareful, both of which end up with zero chance of a decrease at the end of the timeline across all 10,000 simulations.
The fast shipping approach, although deploying twice as many changes, results in a six times smaller cumulative improvement, and has a higher than 50% probability of resulting in a negative cumulative performance at the end of the period
The median cumulative effect for ShipFastt is -11.5%.
True effect averaged over time
Yet another way to examine the value of experimentation is to look at the average performance during the entire timeline. It may be argued that it has an even more direct link to the return on investment (ROI) than the final outcome. The distribution of those averages for each approach is shown on Figure 8.
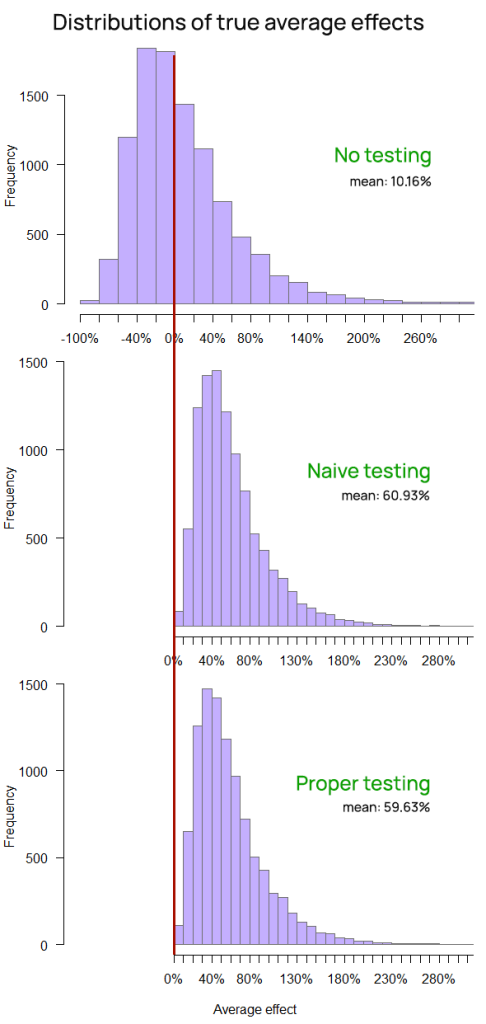
The business value of online A/B testing is made clearly visible. The probability of a negative average change over the 40 time slices is less than 1 in 10,000 for both ShipSimple and ShipCareful.
ShipFastt, despite deploying twice as many changes, results in a seven times smaller average improvement over the entire time frame, and has a slightly over 50% probability of resulting in a negative average performance over the time period.
Table 1 presents a tabulated comparison of the three approaches in the realistic scenario, with all of the numbers being arithmetic means obtained from the 10,000 simulations.
| ShipFastt (No testing) | ShipSimple (Simple Testing) | ShipCareful (Proper Testing) | |
| Cumulative true effect | 20.5% | 142.2% | 139.2% |
| Average true effect | 10.2% | 60.9% | 59.6% |
| Implementation rate | 100% | 52.1% | 44.1% |
| False positive rate | 47.7% | 1.92% | 0.1% |
Better Than Average True Effects
The simulations can be performed with an extremely optimistic view on the ability to generate ideas for beneficial changes, and to implement them in a competent and problem-free manner. It should always be remembered that any single experiment can only test a specific implementation while an idea might require dozens of A/B tests before it is refuted in a satisfactory manner.
The following simulation runs assume that ideas are many times better than the industry average and that designers, copywriters, and developers are so capable at all three companies that each of them has a mean true effect five times (5x) better than the industry average. Instead of 0.5%, the mean effect is 2.5%. Maybe this is even achievable at an early-stage startup with room for improvement wherever one turns or by a team of geniuses and overachievers on every dimension.
Outcomes plotted on Figure 9 show that the no testing approach performs significantly better on average under these favorable circumstances, at least as measured by the cumulative (end) effect. However, ShipFastt still has an infinitely higher probability of falling into a negative spiral than either of the testing approaches. Avoiding such business-destroying pathways is a major reason for the adoption of A/B testing, but that is not all it results in. Figure 9 also makes the value of A/B testing visible in the higher value of the business metric as well as through the near-zero chance of the business ending up worse than the starting position.
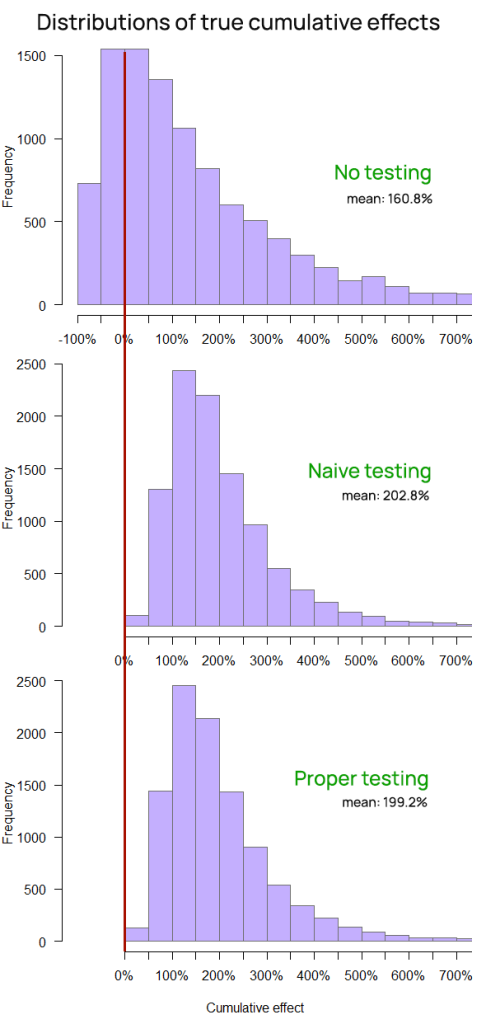
The risk management function of online experimentation is also clearly demonstrated when examining the distribution of the average effect throughout the time slices (Figure 10).
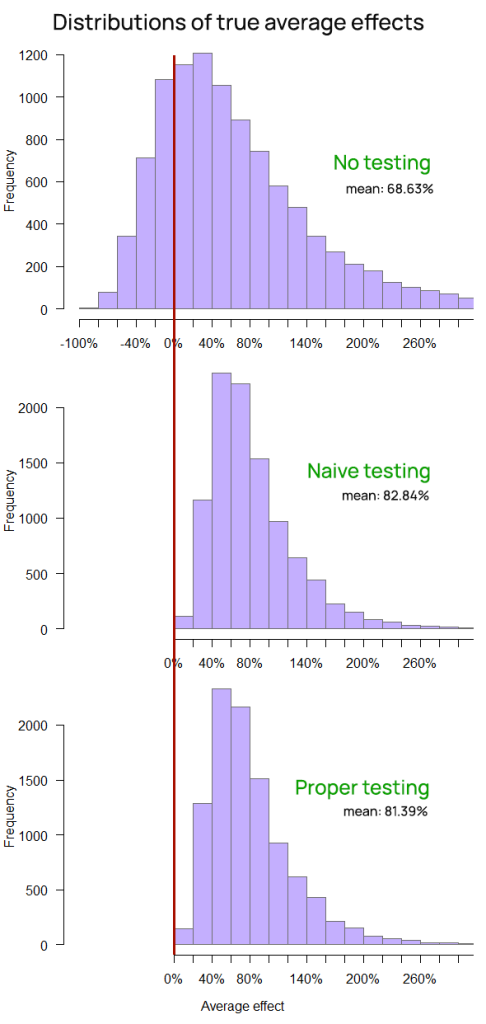
Table 2 contains a tabulated comparison of the three approaches in the scenario of unlikely positive true effects:
| ShipFastt (No testing) | ShipSimple (Simple Testing) | ShipCareful (Proper Testing) | |
| Cumulative true effect | 160.8% | 202.8% | 199.2% |
| Average true effect | 68.6% | 82.8% | 81.4% |
| Implementation rate | 100% | 61.9% | 54.4% |
| False positive rate | 38.0% | 1.73% | 0.09% |
Even under conditions which are much more favorable to ShipFastt’s approach to business growth, it is not able to beat neither the cumulative growth nor the average performance of both ShipSimple and ShipCareful whose approach involves testing each change. Even though their method results in a lower number of implemented changes, both ShipSimple and ShipCareful outpace ShipFast even in a situation which is significantly favorable to its modus operandi.
Worse Than Average True Effects
It is also curious to see what happens if a company, for one reason or another, has really poor ideas or does a bad job implementing them. Maybe a business or product is late in its maturity cycle and everything that could have been improved has already been improved on, resulting in a lot of spinning around without much actual improvement to show for it. Perhaps the environment is also barely shifting leaving no room for any new beneficial changes. Regardless, such a company would also benefit from A/B testing.
Looking at the outcomes of the three hypothetical companies now impaired by their relative lack of ability to introduce positive changes to their product or service, what role does A/B testing play? Figure 11 shows just that.
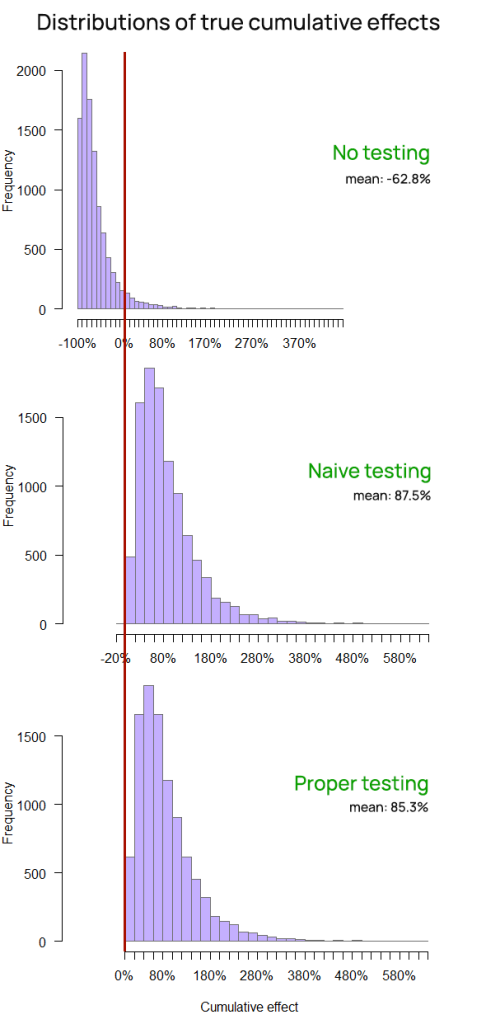
Figure 11: Final effect (cumulative effect) of the three approaches with very pessimistic true effects
Without testing, ShipFastt is quickly and almost surely heading into ruin. The faster it iterates and “innovates”, the worse it ends up being, with high probability. The mean outcome is an abysmal -62.8%.
While ShipSimple and ShipCareful are not thriving as much as they were in both the realistic and optimistic simulations, they are doing quite all right. In fact, proper A/B testing is ensuring ShipCareful has less than 1 in 10,000 chance of seeing a negative cumulative effect, whereas it is just around that number for ShipSimple.
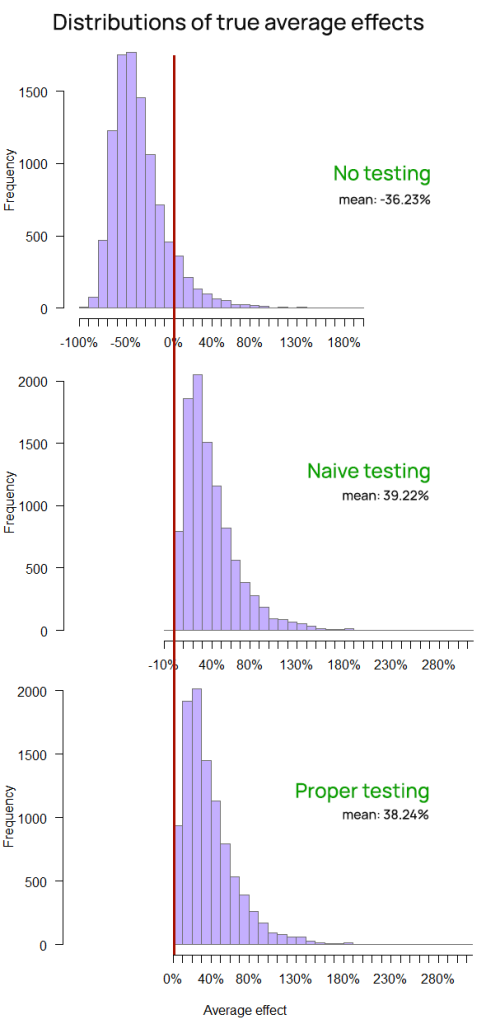
The average effects over the time periods on Figure 12 confirm the positive impact of split testing on business risk and show that the chance of a negative average outcome for ShipFastt is also really high, whereas it is practically non-existent for the two companies that use some form of experimentation.
Table 3 contains a tabulated comparison of the three approaches in the scenario of unlikely positive true effects:
| ShipFastt (No testing) | ShipSimple (Simple Testing) | ShipCareful (Proper Testing) | |
| Cumulative true effect | -62.8% | 87.5% | 85.3% |
| Average true effect | -36.2% | 39.2% | 38.2% |
| Implementation rate | 100% | 61.9% | 54.4% |
| False positive rate | 62.0% | 2.01% | 0.1% |
To recapitulate, with A/B testing, there is no need for a team of geniuses. One does not need more than half of their ideas and implementations to be truly beneficial in order to achieve positive growth. Growth is entirely possible in a smooth fashion even if a company or team is for some reason bad at its job, granted they use a decent experimentation platform.
Even worse-than-mediocre teams and companies can grow and improve their bottom line simply by using experimentation. Not only that, but they can even beat teams with near-average ideation and implementation skills which do not use A/B testing.
The average performance of the impaired version of ShipCareful over the time interval is 38.24% or nearly four times better than that of the average equipped ShipFastt company (at around 10%). The cumulative performance of said ShipCareful is on average more than four times better than that of a well-staffed ShipFastt, meaning ShipCareful would achieve multiple times better growth than an otherwise much better-positioned company acting in a ShipFastt fashion.
A/B Testing for Small Companies & Startups
The business case for A/B testing in smaller companies and startups may be harder to make due to the larger fixed costs of making experimentation a part of the deployment of changes and new functionalities. Variable costs are also higher relative to the expected returns.
While the above are not subject to the current article, there is also the notion that since such a company would have a much smaller sample size to work with (within a reasonable time frame) it may be better off not A/B testing since textbook thresholds such as alpha of 0.05 would not be achievable. Abandoning testing altogether is essentially the ShipFast approach.
To explore whether such advice is warranted, the simulations were re-run with 50,000 observations per A/B test, or 10 times lower than the simulations shared above. This reflects that a smaller business or startup will likely have much fewer users or other kinds of observations to experiment with in a time frame of 1-3 months. The resulting picture does change somewhat. Table 4 shows the tabulated comparison of the three approaches with realistic effect sizes and 50,000 observations per test:
| ShipFastt (No testing) | ShipSimple (Simple Testing) | ShipCareful (Proper Testing) | |
| Cumulative true effect | 19.0% | 134.0% | 111.2% |
| Average true effect | 9.6% | 57.1% | 47.6% |
| Implementation rate | 100% | 51.7% | 29.0% |
| False positive rate | 47.7% | 5.61% | 0.32% |
The ShipFastt outcomes are almost identical to those observed with 500,000 users per test, as can be expected. The advantage of using experimentation shrinks somewhat, with a more notable decrease in the performance of ShipCareful. This is in line with what is expected since the loss of statistical power starts to beget a lower significance threshold. A risk-reward analysis such as the one performed at the A/B testing hub at Analytics Toolkit would be more likely to recommend a significance threshold lower than 0.05 for optimal balance of risk and reward.
For example, increasing the significance threshold from 0.05 to 0.2 (lowering the confidence threshold from 95% to 80%) closes most of the gap between ShipSimple and ShipCareful as shown in Table 5. At this level the average true effect is about 54%, much better than the 47.6% achieved with a stricter threshold, and the implementation rate goes from 29% to around 40% while retaining a multiple times smaller false positive rate than the ShipSimple approach.
| ShipFastt (No testing) | ShipSimple (Simple Testing) | ShipCareful (Proper Testing) | |
| Cumulative true effect | 20.9% | 133.4% | 126.4% |
| Average true effect | 10.0% | 56.9% | 53.9% |
| Implementation rate | 100% | 51.9% | 39.8% |
| False positive rate | 47.7% | 5.59% | 1.61% |
None of the above is to be taken as a guideline to choosing a significance threshold at any given sample size. The proper sample size and significance threshold would depend on a number of parameters, not least of which are the baseline value. I’ve gone into depth on this topic in several articles on this blog, as well as in a whole chapter of “Statistical Methods in Online A/B Testing”.
Even Lower Sample Sizes
Maybe 50,000 seems like a small number of users to test on, but there are A/B testing use cases where even 10,000 users seems like a huge number to work with. The next batch of simulations examine what happens at even lower sample sizes by reducing the available sample size another ten-fold to just 5,000 users (or other observations) per test. These are sample sizes typical for early stage or very niche business-to-consumer (B2C) companies as well as many smaller business-to-business (B2B) operations.
| ShipFastt (No testing) | ShipSimple (Simple Testing) | ShipCareful (Proper Testing) | |
| Cumulative true effect | 21.5% | 98.0% | 77.8% |
| Average true effect | 9.8% | 42.2% | 33.9% |
| Implementation rate | 100% | 50.2% | 26.2% |
| False positive rate | 47.7% | 12.7% | 3.85% |
As evident from Table 6, at these sample sizes, even an alpha threshold of 0.2 (confidence level of 80%) is not nearly enough to reach optimum performance. ShipSimple’s 0.5 alpha (50% confidence) level looks more appealing on the cumulative and average true effect metrics. However, at such thresholds performance takes huge precedence over learning as the rate of false positives climbs to close to 13% of all tests, which is about 1/4 (25%) of implemented variants.
An important question is whether the true effect sizes applied in the simulation correspond to what is actually happening at such companies and such sample sizes. Limited evidence at my disposal suggests that the distribution of true effects would have significantly heavier tails which would even out the performance of ShipSimple and ShipCareful, at least while using a 0.2 significance threshold for the latter. Since there is less actual learning and therefore a lessened ability to both avoid exploring unprofitable paths and to focus on what works, it might be that the quality of the ideas does not improve as much as it would with larger sample sizes. In this sense it is unclear to what extent a hindered learning process would hurt the ability to achieve such true effects in the future.
However, regardless of how low confidence one goes, employing any A/B testing is better than not doing so on every available metric. The above is, of course, assuming the fixed costs of having experimentation capability do not negate the revenue-based returns.
Addressing the Criticisms of Experimentation
After reviewing the outcomes of these extensive simulations, it is worthwhile to address the three common charges against the added value of A/B testing one by one.
Does A/B Testing Stifle Innovation?
If innovation is defined properly, as in “useful novelty” or “beneficial novelty”, then the myth of A/B testing as stifling innovation can surely be put to rest. Simulations with realistic effect sizes show that A/B testing does its job very well in filtering out the bad ideas and implementations from the good ones. A company will benefit significantly from A/B testing even if it is somehow leagues better than others at coming up with good ideas and implementations.
That means that even if a company has an ideation and implementation process which performs above and beyond everyone else’s should not commit to a “no testing” strategy, lest it be surpassed by its less competent peers who employ A/B testing.
The charge may hold more substance for experimentation where the sample sizes are small while the true effects remain small as well. In such cases the criticisms may be valid to the extent that one adheres to a rigid “textbook” significance threshold instead of making an informed choice of a threshold which better reflects their business case. I’ve always argued for a risk/reward analysis to inform these decisions, instead of blindly following so-called “conventions” and have done my best to produce tools which perform these analyses at Analytics Toolkit.
Is A/B Testing an Unnecessary Drag on Product Development?
There is no doubt that A/B testing delays the release of changes and new functionalities. However, focusing on cases where A/B testing delays the release of a change which proves to be beneficial is not particularly useful as it fails to consider the counterfactual. What if that same change had turned out to be harmful? Would the delay necessitated by testing still be viewed as unnecessary? How many such harmful changes were stopped due to testing?
While judging the necessity of A/B testing its effects should always be considered in their totality, and not in isolated instances. In most cases the fixed and variable costs, including delays to full release, would be more than offset by the smoother and significantly steeper growth curve that would be enjoyed as a benefit.
Is A/B testing right for every business at any time? Probably not, as the economics work more favorably the larger a business is. Sometimes the revenue just isn’t enough to justify even a modest investment in A/B testing due to negative ROI. However, for most companies of reasonable size, using experimentation as a core part of their product development would be highly beneficial and far from unnecessary.
What’s the Total Impact of Experimentation on The Bottom Line?
While that is a very complex question to answer and would require a lot of business variables, the simulations above should give you an idea. A/B testing results in significant improvement over going straight to full deployment both by blocking harmful changes and by smoothing out the curve over time. Every business prefers fewer shocks to its revenues and customer acquisition and retention over time so even if that was the only benefit from A/B testing, it might still be worth it for many companies.
Some seem to conflate the benefits of Conversion Rate Optimization (CRO) services, which often come bundled with experimentation, with the value of experimentation itself. While these simulations cannot speak about the benefits of CRO, keeping things in context always helps. If estimating the business value of a CRO program which employs experimentation is seen as too difficult to estimate the ROI of, then no other effort has a chance at producing anything close to a ROI estimate. Randomized controlled experiments are the best available tool for judging the impact of any intervention and if that is not enough then nothing invented to date will suffice.
Considering the direct benefits of blocking harm expressed in multiple times better growth as well as the benefits from producing reliable learnings and better impact estimation and one ends up with a solid business case for A/B testing.
Important caveats
First, in no approach was peeking with intent to stop a test a part of the simulations. Peeking until statistical significance would certainly lead to much worse outcomes for the two approaches that use experiments.
Second, all statistical tests performed are of the fixed-sample size kind to make the simulations more tractable and the outcomes easier to follow. Employing sequential testing (of the GST type in particular) should boost the performance of both ShipSimple and ShipCareful by allowing them to reduce the time for concluding a test by up to 80% (real-world data suggest an expected reduction of about 30%). These statistical methods are available to users of Analytics Toolkit and ABsmartly (where I am an advisor).
Third, the two times slower development time due to A/B testing may be seen as either too generous or too pessimistic. For example, the sequential testing methods mentioned above may improve (decrease) this factor while other facts may increase it, making the added value of experimentation higher or lower than what is estimated above. Simulations exploring the sensitivity to this factor show that it would need to increase about four-fold before the added value of testing approaches zero with realistic effect sizes. If testing results in about eight times longer time to deployment then maybe it will add little benefit in terms of immediate performance.
And finally, the ShipSimple’s approach to testing should not be confused with an approach with no statistical basis or a statistics-free approach. Instead, taking the direction of the observed effect as a basis for implementation is exactly the same as using a significance threshold set at 0.5 (50% confidence) for a one-sided test. In it statistical power takes priority and the goal is to minimize the false negative rate while maintaining a minimal level of type I error control. ShipSimple essentially trades high confidence learning for better momentary performance which could lead to spending more effort pursuing dead ends. This is due to the false positive rate being multiple times higher than what it would be with a stricter significance threshold.
Takeaways
The value of A/B testing for a company or product team is that it:
- Blocks most harmful changes from impacting customers or potential customers over prolonged periods of time. It effectively removes drops from the growth curve of the product or business.
- Results in high confidence outcomes that can serve as a knowledge base which informs future decisions and ideation and allows for reliable estimation of the effect of any change. Knowing what effects certain changes have achieved can be extremely valuable.
- Achieves multiple times higher growth with a smoother growth trajectory compared to simply implementing everything, which in most cases should translate to a favorable return on investment
The above is true even for a stellar team which is multiple times better than everyone else at ideation and implementation. If they are currently not A/B testing, then the business performance will be significantly enhanced by testing all changes as opposed to just implementing everything.
Even if a team is significantly below average in their ideation and implementation skills, they can perform vastly above expectation if all implementations are A/B tested before release. A/B testing will prevent harm from happening to a business even if a majority of their work results in negative true effects. By implementing only statistically significant experiments a business would be saved from most trouble and that would be true even with the simplest approach in which the direction of the observed effect is taken as guide for action. Running a randomized controlled experiment and going with the outcome already delivers a ton of value and results in a large improvement over not A/B testing at all.
Finally, to get the most out of your experimentation program, do not hesitate to test ideas and implementations even if they will surely get released. In a sense, it is especially important to test bug fixes, changes mandated by laws and regulations, and other certain releases. The cost of not A/B testing them may be big as I’ve shared in this anecdotal example. The value of experimentation is not confined to testing optional innovations and wild shots in the dark.


