I’m happy to announce the release of two long-awaited features for our A/B Testing Calculator:
- Support for non-binomial metrics like average revenue per user
- A new custom API for sending experiment data to the calculator
Below is an explanation of each of these new features in some detail.
Support for Non-Binomial Data
While our more basic statistical calculators had support for non-binomial (continuous) data for a few years now – both for sample size calculations and for calculating confidence intervals and statistical significance – such support was lacking from our flagship A/B testing tool. With this addition to the A/B Testing calculator you can now use its powerful and versatile statistical engine to analyse statistical tests in which the primary metric of interest is difference in average revenue per user (ARPU), average order value (AOV), average items per transaction (AIPT), average time on site (ATOS), average sessions per user (ASPU), average transactions per user (ATPU), and so on.
As a quick reminder, the main benefits of using the AGILE testing method include:
- improvement to testing speed by 20%-80% versus classic fixed sample tests
- great flexibility in monitoring the results and making decisions, statistic
- rigorous statistical rules for stopping early both for efficacy and for futility
- post-test estimates for lift, confidence interval bounds and p-values with minimal conditional bias
Of these, only the last one is still a work in progress as we are working on having our engine handle continuous data. Other than that, the engine underwent testing through simulations in order to verify it is working up to specification under various conditions. To our satisfaction, type I error guarantees held even with data featuring time-heterogeneous standard deviation. Mean heterogeneity is a more difficult subject, but I’m happy to get into in another post, if it is of interest (let me know in the comments!).
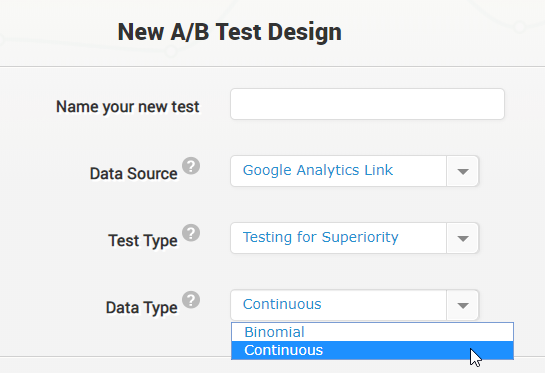
To conduct your first AGILE A/B test with continuous data, simply use the new “Data Type” drop-down and specify “Continuous”:

Remember that for continuous data you need to supply not only an estimate of the expected mean, but also of the expected standard deviation under the null hypothesis in order for the tool to perform accurate power and sample size calculations. This estimate should be based on relevant historical standard deviation and should ideally be seasonality-adjusted.
Same as with estimates for the expected mean or conversion rate, providing an inaccurate estimate for the expected standard deviation may result in under or overestimation of the required sample size (and therefore duration) of the test, which may affect its type II error rate. However, it will have no effect on its type I error guarantees.
It should be noted that while the A/B testing calculator now supports continuous data of all kinds, it does so only if you are using the newly released Custom API. Manual input is not yet support (should we?), and Google Analytics simply does not allow the extraction of the data necessary to compute the standard deviation of metrics other than transaction-based ones.
As result, if you are relying on Google Analytics for your AGILE A/B tests, you can only work with average revenue per user and average transaction value. ARPU is supported by default, while for AOV you need to define a custom segment that includes only users with transactions, and supply it via the “Custom Segment” field in the Google Analytics data link interface. While analysis of average revenue per user is expected to be the main use case, if you are interested in analyzing other continuous metrics you should consider using our API as described below.
Custom API Support
Since the launch of the AGILE A/B testing calculator we’ve had a number of requests for a custom API through which test data to be pushed to the tool for statistical analysis. Some of you had issues with the accuracy of the data in Google Analytics, others used custom platforms which did not send data to Google Analytics at all, and yet others had way too much data and were thus affected by sampling even with weekly data retrieval.
The new API which we release puts an end to the limitation of having to use Google Analytics or Google Optimize in order to automatically push test data to the A/B testing calculator. You can now do this regardless of the testing platform you use and regardless of where you store your A/B test data, as long as you can send it through simple HTTP requests to our API endpoint. Having a convenient way to get access to the power and versatility of using the AGILE statistical method is finally available for all.
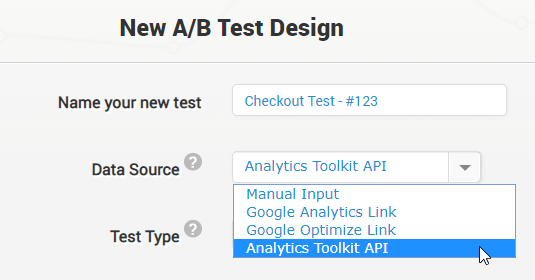
To get access to the new functionality, you need to be on either our Medium or Agency plan. Then, start creating a new AGILE A/B test and simply select “Analytics Toolkit API” for the data source, as shown:

On the Data Entry screen shown after the test is created you will see the API settings for the test, including a link to the API endpoint and the reference manual, detailing the way to send data for your test. We recommend you always use this link to retrieve the latest version of the manual.
Note that the data you send through the API is fully anonymous as we do not require any kind of user ID data (anonymous or pseudonymous) to be sent to us. This means that no legal complications should arise from using the API.
Currently the API doesn’t have any limits on usage. As long as your usage is reasonable, you should not have any trouble. However, Analytics-Toolkit.com reserves the right to impose limits and quotas on API usage in the future.
Both functionalities are launched as public Beta, so reports of any issues you experience will be most appreciated.


