The above is a question asked by some practitioners of A/B testing, as well as a number of their clients when examining the outcome of an online controlled experiment. It may be raised regardless if the outcome is statistically significant or not.
In both cases the fact the observed effect in an A/B test is smaller than the minimum detectable effect (MDE) it was planned for will be treated as cause for concern regarding its trustworthiness. A more educated person might point to this fact speaking of the test being underpowered.
However reasonable it may seem, at its core the question “What to do if the observed effect is smaller than the MDE?” exists due to one or more misunderstandings of the statistical terminology involved. Here are the main topics of this article.
Table of contents:
- What does minimum detectable effect mean?
- Can you compare a hypothetical true effect to an observed effect?
- MDE is not a threshold for the observed effect
- MDE is not the smallest observed effect that can be statistically significant
- MDE is not the smallest true effect that can be detected
- The observed effect is not the true effect
- Is the term “minimum detectable effect” to blame?
What does minimum detectable effect mean?
The minimum detectable effect (MDE) is a hypothetical effect size which, if real, would result in a statistically significant outcome from a statistical test with high probability. How high that probability would be is determined by the desired statistical power level used in planning the test. Typical values are in the ballpark of 80% to 95%.
For example, an A/B test may be planned with 80% power to detect a true relative lift of 2%. Then, if the true lift happens to be exactly 2% the test will produce a statistically significant outcome with a probability of 80%.
Another way to explain the MDE is to define it as the smallest true effect size which the test has high sensitivity to detect, if actually present. “High” in the previous sentence is defined as the chosen power threshold. In any case the MDE represents a point at which achieving the same level of statistical power towards even smaller hypothetical true effects results in undue costs and risks and hence is seen as not worth pursuing.
Can you compare a hypothetical true effect to an observed effect?
There is a common misunderstanding regarding the relationship, or lack thereof, between MDE and the observed effect. Both contain the word “effect”, which make them seem as they have a direct link and are easily comparable. However, “effect” in MDE refers to a hypothetical true effect, whereas the observed effect is a statistic of the data at hand.
Typically, the observed effect is modeled as the actual true effect size plus random noise which can have a negative or positive direction. From the above it is obvious that the observed effect size is not a function of the MDE, nor vice-versa. MDE, being a pre-data characteristic of the test, also has no direct link to the post-data observed effect. Since there is no direct link between the MDE and the observed effect size any perceived relationship between the two is inherently misleading.
In particular, it is irrelevant for data analysis purposes to:
- compare the MDE to the observed effect size
- require the observed effect size to lie anywhere in particular relative to the MDE (for example for the observed effect to be larger than the MDE)
- think that if the observed effect lies below the MDE it cannot be a statistically significant outcome
All of these cases are, figuratively speaking, comparing apples to oranges. Even though both are numbers and both refer to effect sizes, they represent concepts which are not of the same kind so they are not directly comparable.
Despite all of the above some may still be tempted to compare observed effects to MDEs. Here are some common scenarios of attempting to do so and the harm this may cause.
MDE is not a threshold for the observed effect
Similar to viewing statistical power as a threshold that has to be satisfied post-data, some misinterpret the minimum detectable effect as a threshold which should be cleared by the observed effect. For something to work as a threshold, it should be directly related to what is measured against it.
For example, the statistical significance threshold works because it is framed in terms of the p-values that may be observed after a test. The way to achieve α = 0.05 as a test characteristic is to reject the null hypothesis only if the p-value is lower than α. Setting α acts as a cut-off on the p-values.
No such relationship exists between the minimum detectable effect and the observed effect. The MDE is a target characteristic of a statistical test which is achieved the moment the associated sample size is reached, regardless of the outcome. Since MDE refers to a true effect, it cannot be a threshold to be satisfied by an observed effect. Choosing an MDE tells us nothing about where the observed effect would end up being or what observed effects are admissible.
To that end, observing an effect size lower than the MDE is no more cause for concern than observing an effect size equal to or higher than the MDE. At the A/B test data analysis stage, the only threshold to be concerned about is the significance threshold.
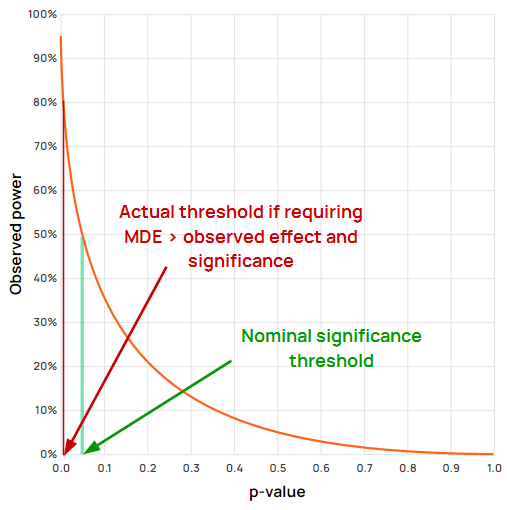
In fact, treating only observed effects greater than the MDE as statistically significant is equivalent to raising the significance threshold by an order of magnitude:

For example, using “textbook” values of α = 0.05 and a power level of 80%, (β = 0.20) to detect some MDE, requiring the observed effect to be greater than the MDE would achieve a type I error rate of about 0.6%, or more than eight times smaller than the target of 5%.
Figure 1 in fact shows clearly that the statistical significance requirement can be dropped entirely since the MDE requirement completely overrides it in every case.
MDE is not the smallest observed effect that can be statistically significant
Some seem to be puzzled by the fact that an observed effect smaller than the MDE can result in a statistically significant outcome. However, there is nothing paradoxical about such an occurrence.
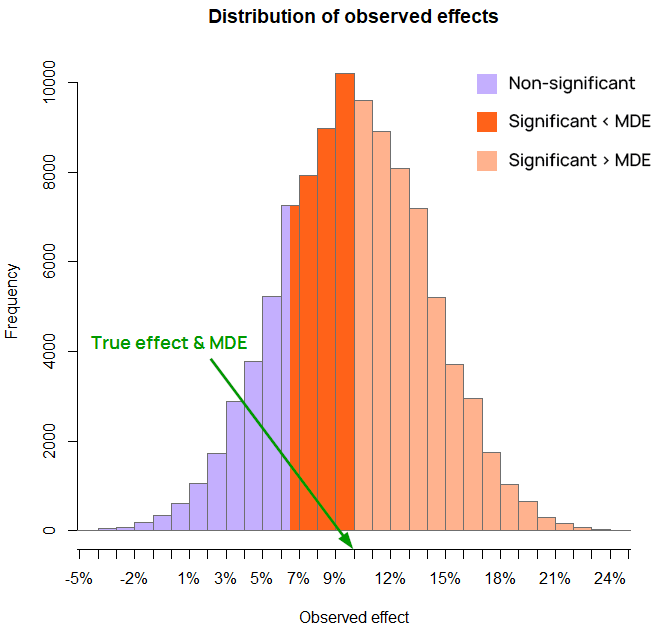
For example, the observed effect would be smaller than the MDE in roughly 50% of cases even when the actual true effect is exactly equal to the MDE. That’s the nature of a data generating process with random symmetrically distributed errors. In a test with statistical power of more than 50% at that MDE it is a probabilistic necessity to have statistically significant outcomes in which the observed effect size is smaller than the MDE. If that were not the case, it would be mathematically impossible for any test to achieve statistical power higher than 50%.

Figure 2 is an illustration of simulation results with a true effect size of 10% relative increase and a baseline of 5%, with a sample size that results in an MDE of 10% lift at the 80% power level (equal to the true effect size). The observed effects shaded in dark orange are below the MDE “yet” they result in statistically significant outcomes. The height of the bar represents the number of simulations (out of 100,000) which ended up with such an effect size.

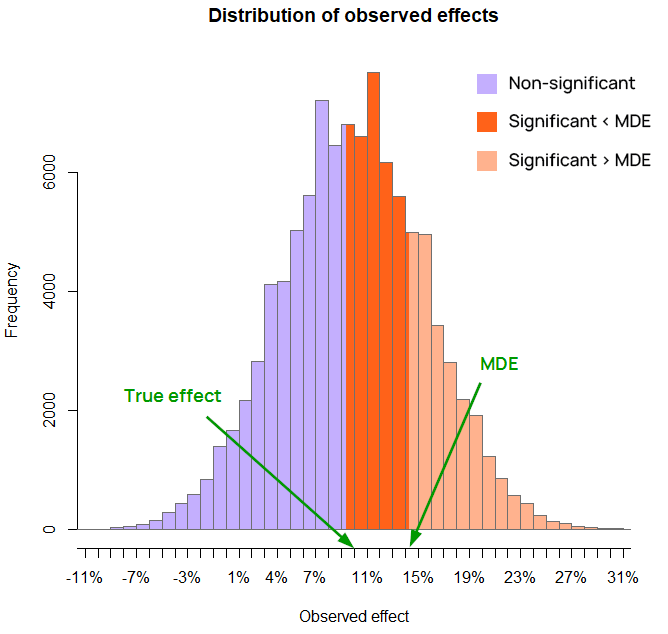
On Figure 3 the MDE at 80% power is 14.2% and is larger than the true effect size (again10%), yet a significant outcome may still come from an observed effect size which is smaller than the MDE.
MDE is not the smallest true effect that can be detected
“Minimum Detectable” does not mean that a statistically significant outcome cannot be produced by a true effect smaller than the MDE. While possibly a rarer mistake, it is worth explaining why. The logic of p-values guarantees a low proportion of statistically significant outcomes under the null hypothesis, and increasingly under values under the alternative, many of which would be smaller than the chosen minimum effect of interest.
Figure 3 above makes this abundantly clear, as the true effect (10% lift) is smaller than the MDE at 80% power (14.2%) and a lot of the observed effects are statistically significant. In fact, the test used in the illustrative example has about 55% power at 10%, so there is 55% probability of observing a significant outcome with a true effect of 10%. This does not contradict the fact that the MDE at the target power level is 14.2%.
In a one-sided test, even true effects in the opposite direction might occasionally produce observed effects which are statistically significant, and so can a true effect equal to zero.
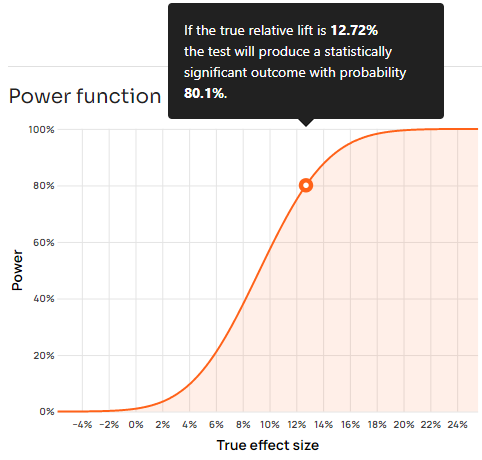
For example, a p-value of 0.01 or smaller would be produced even if there is no real difference between control and variant in an A/B test with a 1% probability. In other words, we would observe a p-value of 0.01 or smaller with a frequency of 1 in 100 experiments even if the effect is exactly zero. This is best shown with a power function:

On the graph above, notice that p-values smaller than the threshold can be produced even from true effects with an opposite sign, albeit with a lower and lower probability the more negative they are. Obviously, hypothetical true effects larger than zero but smaller than the 80% MDE also have some probability of producing statistically significant outcomes, just smaller than 80%.
The observed effect is not the true effect
A line of reasoning about MDE and observed effects first mistakes the observed effect for the true effect, and then submits to the notion that a test’s MDE should be lower than the true effect. It goes like this:
- a test should have high probability to detect the true effect size, whatever it may be
- the best estimate of the true effect size is the observed effect size
- therefore, the MDE should be lower than the observed effect size, otherwise our test has low probability of detecting the true effect size
Here the retort is that the MDE is the minimum effect which is worth detecting. It is another matter if it was chosen poorly, but even such a scenario would not automatically mean the MDE should be reconsidered so as to become smaller than the observed effect since by definition it is not the true effect size, but a result of random noise applied around the true effect.
It is ultimately about statistical power
Insisting that the MDE should be lower than the observed effect for a test to be well-powered the flip side of the problem I dub “the search for true power” since wanting the MDE to be smaller than the observed effect size is exactly the same as wanting a test to have high observed power.
This can be shown by working backwards from the comparison of the observed effect to the MDE. If the observed effect size (δobs) is smaller than the target MDE (say δ′) at some chosen power level (1 – β), then by definition the observed power level would be lower than the chosen power level (δobs < δ′ hence POW(Tα, δobs) < POW(Tα, δ′)). Therefore computing observed power and comparing it to a target power level is exactly the same as comparing the observed effect with the target MDE.
Why fishing for observed power is bad is covered extensively in my comprehensive guide to observed power. If one turns this behavior into peeking until the MDE is smaller than the observed effect size, it is the same as peeking with observed power which is covered in “Using observed power in online A/B tests”.
Is the term “minimum detectable effect” to blame?
For a long time I’ve had my issues with the term “minimum detectable effect” for a number of reasons:
- It does not convey the probabilistic nature of the “detectable” part.
- It is not exactly clear what “effect” refers to: the true effect size, the observed effect size, or a hypothetical effect size.
- It does not hint at the criteria used to judge “minimum” by
The desire to avoid confusions such as the above and to make the term more self-explanatory is one of the reasons I’ve proposed adopting the term Minimum Effect of Interest (MEI) in the chapter on Statistical Power in “Statistical Methods in Online A/B Testing” (2019). As a closer alternative I’ve also proposed Minimum Reliably Detectable Effect or MRDE.
The word “Reliably” added to MRDE should help make it clear that it is not the minimum observed effect that can be significant, nor the minimum true effect which can be “detected”. It also hints at the fact that MDE is always in relationship to a chosen power level.
The term minimum effect of interest conveys that it is an effect that is interesting, and so I believe it makes it clearer both that it is a hypothetical true effect size and also that it is chosen because it is the minimum value of interest. I believe it makes a lot of sense to use it in the context of planning statistical tests, whereas the use of “MDE” can be reserved for describing the characteristics of a test of a given significance threshold and sample size without a direct connection to decision making.
What do you think of these proposed terms? Do you have better ideas? Or should everyone finally understand what MDE refers to?


