In many controlled experiments, including online controlled experiments (a.k.a. A/B tests) the result of interest and hence the inference made is about the relative difference between the control and treatment group. In A/B testing as part of conversion rate optimization and in marketing experiments in general we use the term “percent lift” (“percentage lift”) while in most other contexts terms like “relative difference”, “relative improvement”, “relative change”, “percent effect”, “percent change”, etc. are used as opposed to “absolute difference”, “absolute change” and so on.
In many cases claims about the relative difference in performance between two groups based on statistical significance and confidence intervals are made using calculations intended only for inferences about absolute difference. This leads to reporting nominal significance and confidence levels that correspond to lower uncertainty than there actually is, resulting in false certainty and overconfidence in the data.
In this article I will examine how big the issue is and provide proper calculations for p-values and confidence intervals around estimates for percent change.
Why standard confidence intervals and p-values should not be used for percent change
Say, for example that we have conducted a simple fixed sample size experiment with a superiority alternative hypothesis (H0: δ ≤ 0, HA: δ > 0) with the following outcome:
Control (A) & treatment (B) group observations: 1360 each
Control event rate (conversion rate) PA: 0.10 (10%)
Treatment event rate (conversion rate) PB: 0.12 (12%)
The result is statistically significant at the 0.05 level (95% confidence level) with a p-value for the absolute difference of 0.049 and a confidence interval for the absolute difference of [0.0003 ÷ 0.0397]:
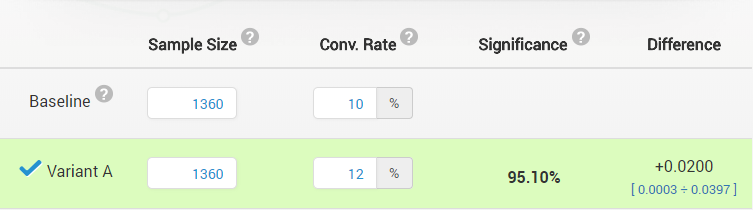
(pardon the difference in notation on the screenshot: “Baseline” corresponds to control (A), and “Variant A” corresponds to treatment (B))
The question is: can one then claim that they have a statistically significant outcome, or a confidence interval that excludes 0% relative difference?
Put in terms of confidence intervals, can one simply convert the 0.0003 and 0.0397 bounds to relative ones by dividing them by the baseline conversion rate? This will result in a confidence interval [0.003 ÷ 0.397] (relative) or in percentages: [0.3% ÷ 39.7%] interval for percent effect. Can one claim that such an interval was generated by a procedure which would, with probability 95%, result in an interval that covers the true relative difference?
The answer is: NO.
The above process results in inaccuracy of the estimation of the type I error probability (α), meaning that the nominal error level does not match the actual error level. As a result, one would proceed to act based on a false sense of security since the uncertainty of the inference is greater than it is believed to be.
The reason for this is simple: the statistic we are calculating the p-value and confidence interval for is for the absolute difference: δabs = (PB – PA), while the claims are for the relative difference: δrel = (PB – PA) / PA or the percentage change δrelPct = (PB – PA) / PA x 100 .
The division by PA adds more variance to δrel and δrelPct so there is no simple correspondence between a p-value or confidence interval calculated for absolute difference and relative difference (between proportions or means). The proper confidence interval in this case spans from -0.5% to 43.1% percent change which covers the “no change” value of 0%, while the proper p-value is 0.0539, meaning that the result is not statistically significant at the 0.05 significance threshold.
How big is the issue? Nominal vs. actual type I errors
In order to understand the issue, I’ve conducted 8 million simulations with 80 different combinations (100,000 sims each) of baseline event rates, effect sizes, and confidence levels, comparing the performance of proper confidence intervals for percent change (% lift) and the approach described above: a naive extrapolation of confidence intervals for absolute difference to ones about relative change. The goals were: to understand how much worse the latter is to the former, how big the discrepancies between nominal type I error and actual coverage and type I error are, and what factors affect them the most.
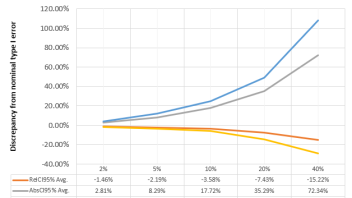
It turned out that there are two factors that affect how badly the naive extrapolation from absolute to relative difference will perform: the size of the true relative difference, and the confidence level.
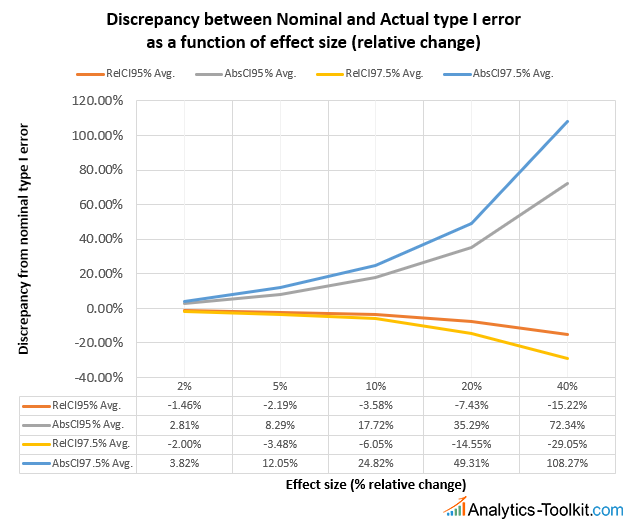
RelCI are intervals for relative difference, while AbsCI are naive extrapolations to relative difference of intervals for absolute difference. 95% and 97.5% are the confidence levels for which the intervals were constructed (nominal level). The intervals calculated are, naturally, one-sided, but equivalent results can be obtained with two-sided intervals.
We can see that the larger the true effect size is, the worse the discrepancy between actual and nominal type I error (α) becomes: if true relative change is below 5% alpha inflation is under 10% and it goes sharply up with increasing effect sizes: for 10% true percent change the inflation is 18-25%, while for a true percent effect of 20% the average discrepancy between nominal and actual error reaches nearly 50% for the 97.5% confidence interval. For 40% true lift the type I error will be 1.72 times higher for a 95% confidence interval and over 2x higher for a 97.5% interval.
In contrast, the larger the true effect, the more conservative the proper confidence interval for percent effect becomes, providing around 20% lower type I error than nominal, up from 2-5% lower when the effect size is below 10%.
In terms of confidence level, we can see that for the same true effect size we have significantly worse relative type I error discrepancy for intervals of higher levels of confidence, e.g. the discrepancy at 10% true percent difference is just 35% at the 95% confidence level while it reaches 50% at the 97.5% confidence level. This is confirmed when we examine the performance with respect to changes in the baseline event rate (conversion rate, e-commerce transaction rate, bounce rate, click-through rate (CTR), etc.):
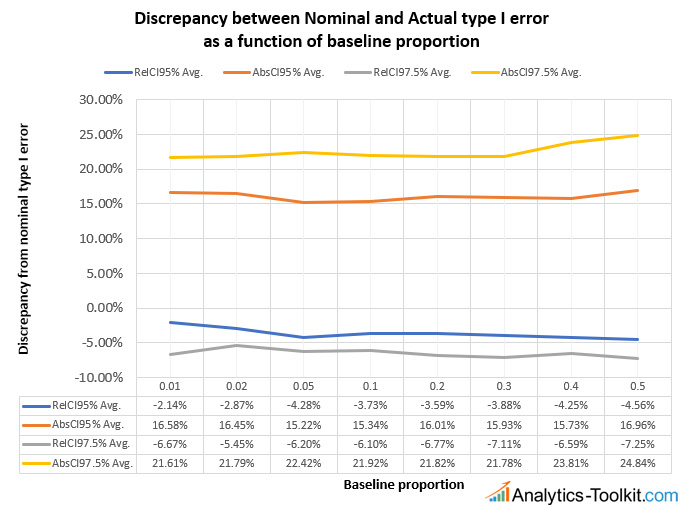
The interval notation is the same, the baseline event rates range from 0.01 (1%) to 0.5 (50%). We can see that the discrepancy between nominal and actual type I error is pretty much invariant to the baseline. The absolute difference interval reports slightly worse performance at high baseline levels, while the relative difference interval has a slightly more exact coverage when the baseline rate is in the 1-2% range.
I believe the results should be applicable to more advanced types of statistical tests, including sequential sampling tests such as those done under the AGILE A/B Testing framework, as well as tests with other hypothesis such as non-inferiority ones.
To recap, the problem is of pretty significant magnitude, especially when the expected percentage change is larger than 5% or the required level of confidence is high. Tests / experiments in which the null hypothesis for relative difference was ruled out with a p-value for absolute difference that is close to the significance threshold or a confidence interval which barely excludes the no difference point may need to be reevaluated.
Confidence intervals for percent effect
It turned out that despite the apparently ubiquitous inferences about percent change and relative differences there are very few sources that mention how one can calculate the standardized error or confidence interval bounds for such a statistic. A couple of sources, including technical manuals for governmental agencies and such list a standard error calculation based on the Delta method, which is usually proven using Taylor’s theorem and of which a first-order Taylor’s expansion is a special case. It gives an approximate result in the form of:
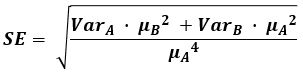
where VarA and VarB denote the variance of the two groups. The formula, however, results in intervals which are significantly wider than necessary, they are way too conservative and their coverage – much higher than advertised. Similarly, p-values are also too conservative. As result, sample size calculations based on the above approximation formula are significantly inflated.
The best interval calculation formula that I have found for relative differences between proportions or means is one listed in Kohavi et al.’s 2009 paper “Controlled experiments on the web: survey and practical guide” [1]:
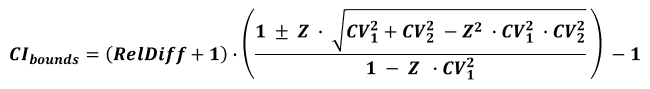
where RelDiff is the relative difference between the two means or proportions, CVA is the coefficient of variation for the control and CVB is the coefficient of variation of the treatment group, while Z is the standardized Z score corresponding to the desired level of confidence.
The simulations you saw results from above were calculated using this second formula and so we consider the good coverage of this interval proven.
See this in action
Robust p-value and confidence interval calculation.
P-values for percent effect
Unfortunately, I am not aware of a straightforward way for calculating a p-value based on the same approach used to calculate this confidence interval. A p-value calculated with the standard error approximation from the Delta method will be far too conservative.
I’ve devised a method through which the p-value can be calculated with a great accuracy, but it cannot be expressed in a purely numerical form. The idea is that you would iterate on the interval using different Z-values and honing in on a value that results in an interval that just barely excludes the null hypothesis. We are working on a more straightforward method, but are not certain that a satisfactory numerical solution exists and we cannot share a deadline at the moment.
See this in action
Advanced significance & confidence interval calculator.
Sample size for inferences regarding percent change / relative difference
From the differences in confidence intervals and p-value calculations it should be obvious that larger sample sizes are required for experiments in which relative difference is of interest in terms of the primary evaluation criterion. Through extensive simulations we have established that the sample size for such a statistical test needs to be increased by between 1 and 4%, compared to a statistical design where absolute difference is of interest, to maintain the same statistical power versus the minimum detectable effect of interest (MDE). The average sample size increase is about 2% and I believe these types of differences should not be a turn-off to using proper sample size calculation when one is interested in percent change.
UPDATE Sep 17, 2018: After some back and forth we have worked out a good sample size calculation solution which is now implemented in our statistical calculators.
Updates to our statistical calculators
We at Analytics-Toolkit.com have already updated our basic statistical calculators which now give you the choice to select whether you are making conclusions about relative versus absolute difference. Sample size calculations also differ depending on the outcome of interest and are currently approximate until a proper solution is devised (still better than none). We are working on updating our more advanced tools such as the A/B testing calculator and the A/B Testing ROI calculator.
References
1 Kohavi et al. (2009) “Controlled experiments on the web: survey and practical guide” Data Mining and Knowledge Discovery 18:151
NOTE: initially the formula for relative difference / percent difference included an extra square root in the denominator. This was fixed on Feb 13, 2020.
About the author

Managing owner of Web Focus and creator of Analytics-toolkit.com, Georgi has over twenty years of experience in online marketing, web analytics, statistics, and design of business experiments for hundreds of websites.
He is the author of the book "Statistical Methods in Online A/B Testing", of white papers on statistical analysis of A/B tests, and has been a speaker at conferences, seminars, and courses. Georgi has been distinguished as a winner in the Data & Analytics category of the 2024 Experimentation Thought Leadership Awards.


Hi,
Great work on this. I have the exact same problem and this blog was the only resource i could find. I have a few questions:
1. You mentioned that the p-value calculation is not easy to derive. Any approximations you have found since?
2. The CI formula refers to coefficient of variation (CV). What is the formula for this parameter?
Thanks again
Hi Sri,
Yes, the issue is not researched enough. The p-value calculation is iterative approximation, there is no analytical solution (formula) we know of. The coefficient of variation is the usual basic formula of standard deviation divided by the observed mean, e.g. as seen here: https://www.gigacalculator.com/calculators/coefficient-of-variation-calculator.php .
The taylor series formula is incorrect, it should be in its simplest form
se = sqrt( (muB/muA)^2 * ( varA/muA^2 + varB/muB^2) )
a verbose version shows the dependence on (muB – muA)
se = sqrt ( (varA+varB)/muA^2 + 2*varA*(muB-muA)/muA^3 + varA*(muB-muA)^2/muA^4 )
I don’t have the time to go through the derivation, I didn’t do it originally as well, just found it in the few sources I was able to dig up. However, I did plug your se formula into my simulations in place of the one cited in the post and it produces virtually identical results: wider than optimal intervals which are wider than Kohavi as well, confirmed with 10 mln sim runs for each of the three formulas and several input parameter sets (muA, muB, conf. level). In fact, it seems to result in slightly wider intervals than the ones produced by the formula in the post, which is expected as the se result I got from yours is larger than the se produced by the formula in the post, for all values I’ve checked. Obviously, both the formula cited in the post and yours are decent approximations, just not as good as Kohavi’s.