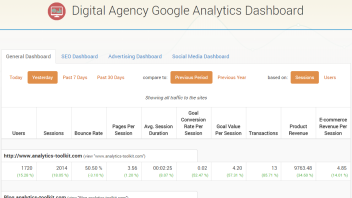
We’re happy to announce yet another addition to our Google Analytics Toolkit: Google Analytics Dashboard.
This new tool is aimed at digital agencies and let’s you view all your client’s most important metrics at a glance, all in one place. It basically eliminates the need to navigate to each client’s Google Analytics account and property to just check their vitals. The dashboard surfaces all the important information in an easy to use dashboard and allows you to monitor their performance at a high level easily and without setting up dozens of alerts. It displays information from 20 of your properties on one screen and there is a pagination that you can use to see all your properties.
Our Analytics Dashboard surfaces information from the default view for each property you have activated for use in Analytics-Toolkit.com. You can always change the default view for a property from the Google Analytics admin section. If you want to be able to switch between different views for a property – sorry, that’s not supported atm.
Different Dashboard for Different Agencies
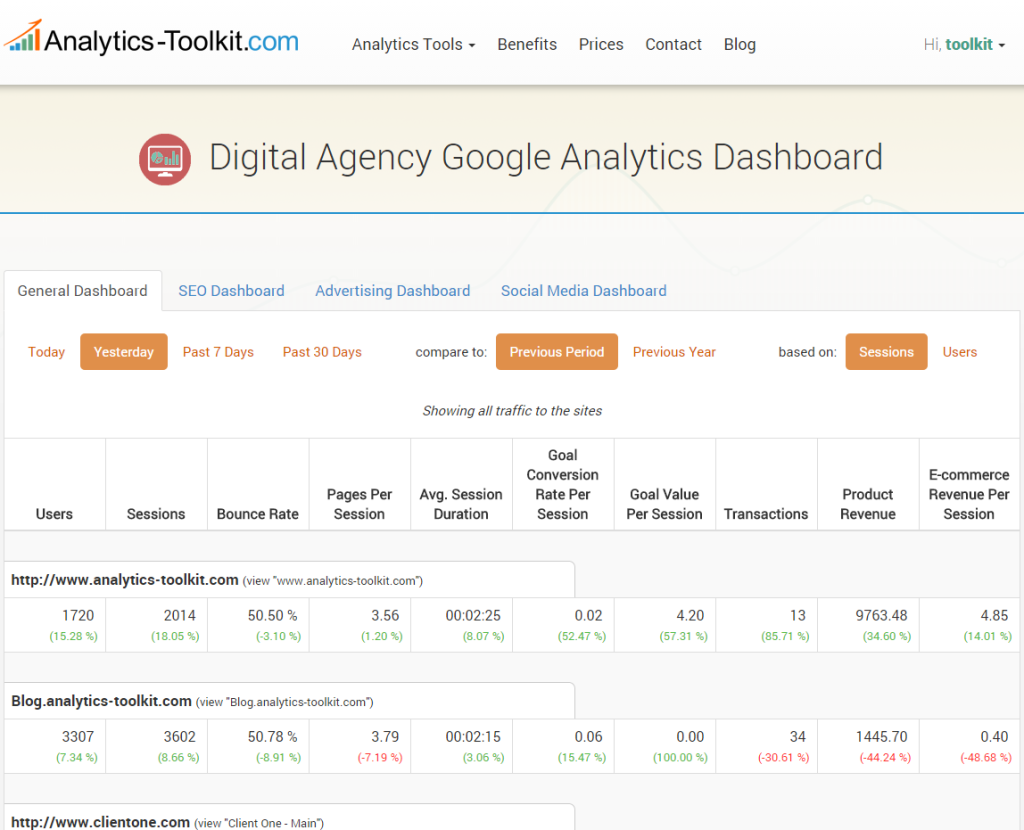
The tool features several different types of dashboards that are suited for different types of digital agencies: SEO agencies, Social Media agencies and Paid Advertising (PPC, AdWords, etc.) agencies. They display only data for the corresponding traffic sources: organic search, social media, AdWords, Bing and other PPC/CPM traffic. Of course, if you’re an agency delivering services in more than one area or in all areas then the dashboard is even more useful to you since you can switch from one view to another with a single click.
Comparison Modes & Metric Calculation Modes
The Google Analytics Dashboard has two date range comparison modes – previous period and previous year (year over year). This is in line with the functionality you have in Googel Analytics itself. You can easily switch between the two, depending on your immediate needs. The default mode is previous period.
You see the trend versus the previous period or year displayed in percentages below each metric and if you hover over the percentage you can see what the corresponding metric was in the previous period or year. Green is good and red is bad and we do take into account that bounce rate going up is generally bad (same for some other metrics).
Since we often see clients are more interested in user-based conversion metrics rather than session-based ones we’ve also included the option to calculate all metrics based on the numbers of users instead of the number of sessions. This means that all conversion rate-like metrics are recalculated so that they are based on users: goal conversion rate, e-commerce conversion rate and goal value per session. This functionality is only available in the General Dashboard for now, but can be expanded to the others if there is interest towards that.
About the author

Managing owner of Web Focus and creator of Analytics-toolkit.com, Georgi has over twenty years of experience in online marketing, web analytics, statistics, and design of business experiments for hundreds of websites.
He is the author of the book "Statistical Methods in Online A/B Testing", of white papers on statistical analysis of A/B tests, and has been a speaker at conferences, seminars, and courses. Georgi has been distinguished as a winner in the Data & Analytics category of the 2024 Experimentation Thought Leadership Awards.

Georgi,
This is awesome and something we really needed. We’ve been doing this in Google Docs but it has its challenges. One feature request I’d add is the ability to leave comments or notes on each client. For example we need to know that in Feb a client merged two sites together so of course their traffic has increased year over year etc…
Thanks!
Mike
Hi Mike,
Appreciate it. While I can see while such a functionality can be helpful, it’s likely not going to make it in during the next couple of months. We’ll consider it for our development schedule, though.
Thanks,
Georgi