
Given that site speed is a direct factor for AdWords landing pages, a major factor in Usability/UX/Conversion Rate optimization and a direct or undirect (I don’t think there is a consensus on that) factor in SEO, it’s no wonder many specialists nowadays pay close attention to page load times.

Why Google Analycis for Site Speed Testing/Tracking?
I believe the Site Speed reports in Google Analytics are about the most underrated report there is in there. Many people don’t really go there and confine themselves to tools like PingDom, WebPageTest.org, WebSiteTest.com, PageScoring or some similar tools or even worse – limit themselves to local testing tools only, like YSlow and the Chrome PageSpeed plugin. While these are certainly great tools, they do have their limitations. The one that they all share is the fact that they are not a good approximation for your average user.
Google Analytics solves this for you. It gather data from actual users who are actually interested in your site in some manner. Thus it gathers data from actual machines (desktop, tablet, laptop, mobile, etc.) under actual load, on actual internet connections (varying in bandwidth and performance) and with actual people sitting behind them, being influenced by your site’s loading speed (reflected in bounces, time on site, pages/visit, etc.). None of the abovementioned tools gets anywhere close to that level of analysis. What I’m saying is that only Google Analytics or a similar tool can provide you with such a screenshot:
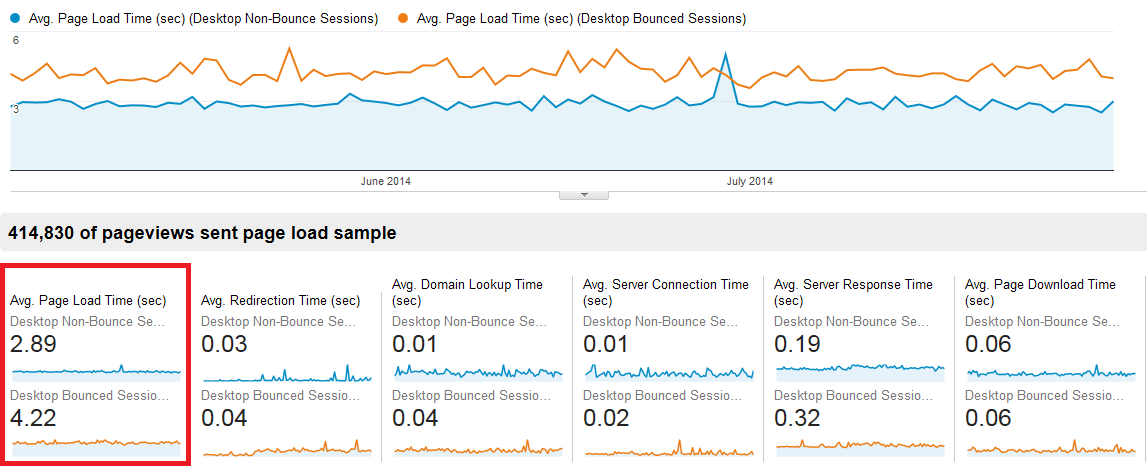
Website Site Speed and Bounce Rate Correlation
Are You Gathering Enough Data?
When you first take a look at your site speed report, you might get a bit freaked out. Part of this is due to not applying the mandatory segments I’ll touch on shortly, but in most cases the issue caused by Google Analytics’ default setting which only collects pageload speed data for about 1% (yes, one percent) of your users. This means that if you have 1000 users per day on average, only 10 (yes, that’s “ten”) of them will send pageload data to GA. You only need one user with a slower connection, browser or whatever to move the average load time several seconds up.
In order to solve this, if you are using Universal Analytics, you need to set a value to the “setSiteSpeedSample” rate variable. If you are using our toolkit, you can do this easily with our Analytics Code Wizard. If you aren’t, here is one way to accomplish that. Modify your ga(‘create’) call to include the siteSpeedSampleRate variable:
ga('create', 'UA-XXXX-Y', {'cookieDomain': 'domain.com', 'siteSpeedSampleRate': 100});
The above code is for Universal Analytics (analytics.js library). If you are still using the ga.js async library, you need to add the following line after you’ve initiated the tracker and before calling _trackPageview:
_gaq.push(['_setSiteSpeedSampleRate', 100]);
Setting siteSpeedSampleRate to 100 would instruct Google Analytics to try and gather page speed data from each and every visitors to your site. You can use a more conservative value if your site has millions of GA calls (pageviews, events, timing events, etc.) daily and you fear about reaching their free account quotas. This ensures you get enough data for a proper analysis. Also, it would take much less time between site speed optimization work and confirming the results this way.
Even when you’ve done this, you will not get site speed data for all of your users. That’s because:
Site speed can only be tracked from browsers that support the HTML5 Navigation Timing interface or have the Google Toolbar installed. Typically this includes: Chrome, Firefox 7 and above, Internet Explorer 9 and above, Android 4.0 browser and above, as well as earlier versions of Internet Explorer with the Google Toolbar installed. (quote from Google’s Help Files)
However, at time of writing this article a lot of browsers support the Navigation Timing interface which means that a enough data is being gathered in most cases.
Mandatory Site Speed Data Segments
After you’ve gathered at least a week of site speed data, it’s finally time to analyze! You may still be shocked by how slow your site is. Fear not, though, as the explanation might be more trivial than you suppose.
When looking at the site speed reports in Google Analytics, you should always segment first by country and then by device type (or both). Those two have the greatest impact on the average values you see.
Here is an example of the data, segmented by device type:
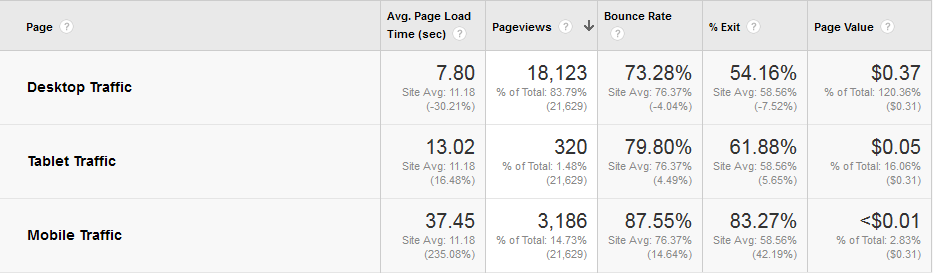
Site Speed on Different Device Types
The differences are very signigicant and tend to be present in pretty much all of the site’s I’ve worked with. Part of the reason is the device’s processing power, another part is that different device types usually differ in the internet connection type they use. In all cases, the numbers are different enough in 99% of cases to allow me to say that it’s mandatory to view them in separate buckets all the time.
And here is the breakdown by country:
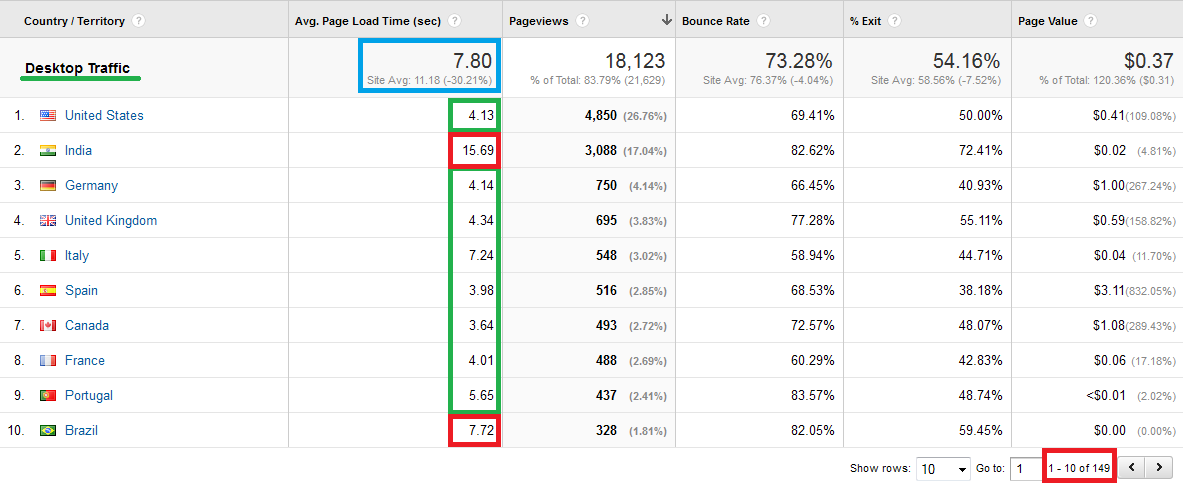
Site Speed by Country
The data above is from a tech-oriented US website with a primary market in the US and somewhat in Europe. As you can see if you were looking only at the aggregate value of 7:80 you would conclude that there is likely a problem with the website or server. However, when segmenting by country it’s clearly visible that for the main market in the USA the site is quite snappy and for Europe it’s OK-ish. It’s India and other countries with likely slow interent, old PC-s or other issues that are pulling the metric down, but we don’t care about those anyways (in this particular case).
In some cases it is advisable to investigate performance by ISP. Especially in big countries with many providers, there might be significant differences in page speed values between them and if an important provider is lagging behind, you may want to consider using a data center that has better connectivity to it or setting up mirror sites to serve those ISPs closer to their end users.
Site Speed Metrics & Dimensions and How to Improve Page Load Time
In order to understand the metrics, you need to have a rough idea of the HTML5 Navigation Timing specification. If you don’t, use Google and spend some time studying it. Here are the more important metrics and my short recommendations on what you can do if a value is high and hurting page load times:
- Page Load Sample: The number of pageviews that were sampled to calculate the average page-load time. Make sure that you are basing your decisions on a big enough page load sample.
- Avg Page Load Time: The average amount of time (in seconds) it takes that page to load, from initiation of the pageview (e.g., click on a page link) to load completion in the browser. This is a combination/sum of all other metrics.
- Avg. Server Response Time: The time for your server to respond to a user request, including the network time from the user’s location to your server. If you are underperforming here, try to reduce backend processing time (optimize scripts and SQL queries, employ caching) or place a server closer to users.
- Avg. Page Download Time: The time to download your page. If you are lagging in this area, try to reduce your initial data size (html). Start by using compression, minifying, removing inline CSS & JS unless totally necessary.
- Avg. Document Interactive Time: The average time (in seconds) that the browser takes to parse the document (DOMInteractive), including the network time from the user’s location to your server. At this time, the user can interact with the Document Object Model even though it is not fully loaded.
- Avg. Document Content Loaded Time: The average time (in seconds) that the browser takes to parse the document and execute deferred and parser-inserted scripts (DOMContentLoaded), including the network time from the user’s location to your server. Parsing of the document is finished, the Document Object Model is ready, but referenced style sheets, images, and subframes may not be finished loading. This event is often the starting point for javascript framework execution, e.g., JQuery’s onready() callback, etc.
This tool is really helpful in tackling the most severe issues with the last two metrics. There are several more metrics that you’ll likely never have to look at. Remember that when you consider in which areas to increase speed, you should always target the slowest speed metrics first (the ones with large values for load times).
Make sure to segment the data by page. It may turn out that only several of your pages are behaving badly and the rest are champions. Remember that averages often hide the real insights, so examine pages or groups of similar pages for patterns of slow load timings.
There is more that can be said about the site speed report in Google Analytics, but I believe the above is more than an excellent start.
Happy site speed optimization!
About the author

Managing owner of Web Focus and creator of Analytics-toolkit.com, Georgi has over twenty years of experience in online marketing, web analytics, statistics, and design of business experiments for hundreds of websites.
He is the author of the book "Statistical Methods in Online A/B Testing", of white papers on statistical analysis of A/B tests, and has been a speaker at conferences, seminars, and courses. Georgi has been distinguished as a winner in the Data & Analytics category of the 2024 Experimentation Thought Leadership Awards.
