
What is Statistical Power?
In null-hypothesis statistical testing (NHST) – the procedure most commonly applied in A/B tests, there are two types of errors that practitioners should care about, type I and type II errors. Type I is the probability of the test procedure to falsely reject a true null hypothesis. Type II error is the probability of the test procedure to fail to reject a false null hypothesis.
For those who are sweating around the choice of null and alternative hypothesis, there is a simple piece of advice – 99.9% of the time the null hypothesis in A/B tests is the composite hypothesis that there is no difference between the control and the tested variants and that there is negative lift. The alternative hypothesis is complementary to the null – that is that there is a positive effect or lift. That’s also called a one-sided test, since we only care about correctly measuring a positive change and we don’t care exactly how bad the result is, as long as it is negative.
Here is a simple matrix to illustrate the relationship between the two types of errors and inference from an A/B test:
| Judgement of Null Hypothesis | Null Hypothesis (H0) is | |
| Valid/True | Invalid/False | |
| Reject | Type I Error (false positive) | Correct Inference (true positive) |
| Fail to Reject | Correct Inference (true negative) | Type II Error (false negative) |
So, phrasing it differently a type I error is asserting something that is absent, while a type II error is failure to assert something that is present, e.g. a true lift of a given magnitude.
The rate of the type II error is denoted by the Greek letter β (beta). Statistical power is then the inverse of that, or 1−β. So, if the type II error rate is 10% (0.1) the test has 100% – 10% = 90% statistical power (or 1 – 0.1 = 0.9). I think the term sensitivity makes more sense intuitively and it also correctly describes what increasing or decreasing the power of a test does – increases or decreases its sensitivity to a particular effect size and statistical significance level. That’s why I use “test sensitivity” and also “chance to detect effect” interchangeably with “statistical power”.
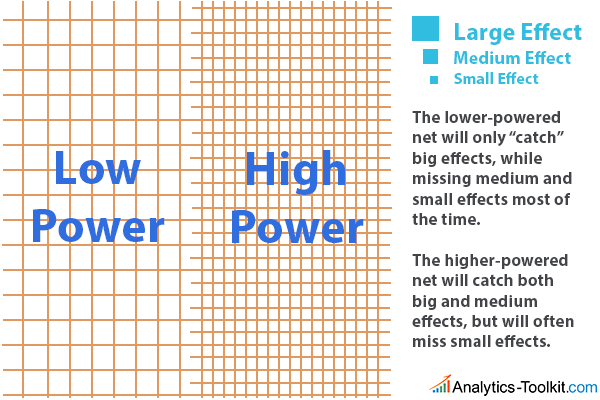
An analogy that I think is appropriate is with a fishing net, imagining the potential results from a test are like a lake of fish – some are small, some are medium, some are large. A low powered test is like a net with wider gaps in it – it’s easier to produce such a net, but smaller fish will simply go through the gaps meaning one won’t be able to capture or “detect” them. On the other side, a finer net (higher power) requires more work to produce, but is able to capture smaller fish.
Thus: Absence of evidence is not evidence of absence, unless your test has proper power! That is, if your test has high enough sensitivity to detect a particular effect, failure to detect it can be interpreted as evidence of absence to the extent warranted by the power level. In A/B testing, failing to detect a statistically significant effect of a given size does not mean that there is no effect if the test has low power. The test variant was not given a fair chance. If the power is high though, then one can say that with high certainty there is no true effect equal to or larger than the effect size the test was powered for (has a particular level of sensitivity towards).
Statistical Power vs Statistical Significance
The concept of power is by definition related to three parameters of the design of an A/B experiment: the minimum effect size of interest, the level of statistical significance that is set as a threshold for rejecting the null hypothesis, and the sample size. The relationship is as follows:
- The higher the statistical significance threshold, the lower the power or sensitivity of the test, given the same number of users and the same minimum effect of interest.
- The lower the minimum effect of interest, the lower the power to detect an effect as big or bigger than the minimum, given the same number of users and the same statistical significance threshold.
- The higher the number of users (sample size) committed to a test, the higher the power of the test will be, given the statistical significance threshold and minimum effect of interest are fixed.
- Finally, the higher the number of tested variants, the lower the power of the test, given everything else is fixed (and proper multiplicity testing adjustments are employed, otherwise the effect is the opposite!).
Here is a graphical representation of the above relationships:
| A/B Test Parameters | Change Direction | Effect on Power (all else equal) |
| Minimum Effect of Interest | ⇧ | ⇧ |
| ⇩ | ⇩ | |
| Statistical Significance Threshold (% certainty) | ⇧ | ⇩ |
| ⇩ | ⇧ | |
| Sample Size (# of Users) | ⇧ | ⇧ |
| ⇩ | ⇩ | |
| Number of Variants | ⇧ | ⇩ |
| ⇩ | ⇧ |
What is to be done in order to preserve the power so that a test does not miss too many true winners while taking a reasonable amount of time? Usually, the power of a test is preserved by increasing the number of users committed to it, since increasing the number of users in a test increases its sensitivity to the same effect size with the same significance threshold.
On some occasions, there will be time pressure which makes increasing the power of the test impossible. In such situations, one can either accept a less powerful test, or decide to increase the effect size or decrease the statistical significance threshold. However, this should rarely happen, since both the minimum effect of interest and the probability of type I error should take precedence over power. In most such cases running an under-powered test and hoping for the best is the only option.
If the power level is more important than the statistical significance threshold, there is probably something wrong in the A/B test design. The error with more severe consequences should be expressed in the type I error threshold, meaning that the null hypothesis should be framed appropriately. The error with less severe consequences should be controlled by the type II error threshold. In terms of A/B tests the proper design would be to have the null hypothesis cover no difference and negative lift, while the alternative is positive lift. With such a design one tests for the superiority of the treatment. There might theoretically be cases where flipping the hypotheses is justified (a non-inferiority design), but they should be rare in practice.
Choosing the Power Level for an A/B Test Design
As it should already be clear from the above, statistical power is very important in the design stage of an A/B test and special attention should be paid if one is to avoid wasting resources in planning, developing, deploying, monitoring and analyzing A/B tests. This is true regardless of the particular area of testing: conversion rate optimization, landing page optimization, e-mail marketing optimization, PPC optimization.
The potential for wasted resources comes in two forms: under-powered and over-powered tests. A relatively under-powered test is likely to fail to detect a true improvement of the given minimum effect size, thus both wasting the resources invested in test planning and execution and also failing to capitalize on the opportunity to improve future earnings (missed revenue). A relatively over-powered test, on the other hand, is likely to require more resources than necessary and it will delay the deployment of an effective variant, again missing potential revenue. The later is almost a non-issue with a test following the AGILE A/B testing method, especially one with more than a couple of interim analyses.
Avoiding each of the above scenarios is why having an adequate power level is so important.
The decision on the power level of an A/B test is usually informed by multiple factors. It depends, for example, on the potential losses of missing a true effect of the specified size – the higher such losses are expected to be, the greater the power should be. Another factor is the difficulty and costs involved in preparing the test – the costlier it is, the more sensitive we’d like the test to be, so the resulting variants are given a fair chance at proving themselves superior, if they in fact are.
Another straightforward factor is how costly it is to commit x% more users into the test. If it is relatively cheap to add more users, then it makes sense to strive for higher sensitivity so as to minimize the probability of missing a true winner.
Hard or soft time limits are another factor, closely related to the number of users one can commit to a test. If there is a hard-set launch date, for example due to an upcoming event, then by necessity a test will run with less users than would be ideal. Another issue is presented when the interval in which the test can be conducted is limited by the nature of the tested phenomena so the test can only run during specified seasons, or only specified dates or weeks, for example Black Friday, Cyber Monday, Christmas Holidays, etc.
See this in action
Estimate the false negative rate & sensitivity of a test.
In short, power should be kept relatively high: if test preparation is long and difficult; if increasing the sample size is cheap; or if the expected value from a given lift outweighs the cost of committing more users and of continuing to manage the test.
Power in AGILE A/B Tests
Statistical power in an AGILE setting is not that different in that the same relations between statistical significance, minimum effect of interest, number of users and number of variants hold true. When planning an A/B test under the AGILE statistical approach, sample size adjustments are made in order to control the sensitivity level at the desired threshold.
Power (called “chance to detect effect” in our interface) is also used to construct the futility stopping boundary, which is a boundary that if crossed suggests stopping due to the probability of detecting a true lift of a given size and with a set statistical significance being smaller than the desired. This is accomplished by employing a beta-spending function, which can have a binding or non-binding relation to the alpha-stopping boundary. Thus, setting the power level higher means the lower boundary will be closer to the upper boundary, decreasing the space between the two boundaries and thus increasing the probability for a stop for futility at an interim analysis.
This happens since setting the sensitivity to a higher number simply means one is less comfortable with missing true differences, hence it’s easier to stop early when the results are unpromising enough.
A more in-depth discussion on statistical power, MDE and designing A/B tests should be of interest to the reader who made it thus far.
See this in action
The all-in-one A/B testing statistics solution
Bonus Tip for reading to this point
Make sure that your baseline is not inflated! The noisier the data is, the less powerful the test and data is noisier at lower base rates. The larger the baseline, the lower the base rate, leading to the need to commit significantly more users to a test, even though everything else is the same. For example, if testing an improvement in the checkout process, the test should only include users who reach the first step of the checkout in the test. If testing add to cart buttons, then the test should include only users who saw these buttons (e.g. only those who visited a product detail page, if that’s the only place the buttons are present). A quick numerical example follows.
Let’s say there are 300 000 users a month visiting an e-commerce store for which the goal is to improve the checkout flow in order to improve the conversion rate. 0.7% (2100) of the 300 000 users would convert in a usual month – that’s the baseline conversion rate. Now, to run a test with a 10% relative minimum effect of interest, 95% statistical significance threshold, and a 90% power level, one would need about 255023 users per test variant (510046 in total with 1 variant).
Let’s say that of these 300 000 only 10% on average reach the first step of the checkout, that is 30 000 users per month. For these the conversion rate will be 2,100/30,000 = 7%. To detect the same 10% relative minimum effect of interest, again at 95% statistical significance threshold and with 90% power level, one would only need about 23799 users per test variant (47598 in total with 1 variant), or ~90.7% less users compared to the situation where all the users of the site serve as a baseline.
That’s because of the properties of the binomial distribution where the extremes are increasingly noisier and consequently it’s harder to get a clear “signal” (low base rate problem, do not confuse it with the low base rate fallacy!). The calculations above use our basic Sample Size Calculator.
About the author

Managing owner of Web Focus and creator of Analytics-toolkit.com, Georgi has over twenty years of experience in online marketing, web analytics, statistics, and design of business experiments for hundreds of websites.
He is the author of the book "Statistical Methods in Online A/B Testing", of white papers on statistical analysis of A/B tests, and has been a speaker at conferences, seminars, and courses. Georgi has been distinguished as a winner in the Data & Analytics category of the 2024 Experimentation Thought Leadership Awards.

