
In the first part of this article we talked about how to set up content groupings in Google Analytics and how to make sure it’s working as expected. In this part we’ll discuss the 4 main benefits of having content groupings defined. If I have to sum it up in one word, I would go with “order”!

TL:DR You gain one new metric – unique views, you get a quick and easy way to access group-level stats and that you can use the navigation summary report and behavior flow report to analyse high-level user flows with much great efficiency.
I guarantee you’ll practically rediscover the last two, especially the behavior flow report. I think people often don’t realize the unique usefulness content groupings add to them and this is a main reason why content groupings are underused so far, in my personal experience.
I’ll go over each of these benefits with explanations and examples.
New Metric: Content Group Unique Views
One of the important gains you get when defining a content group is the ability to see the unique views metric for each group. The Unique Views count for a given content group represents the number of sessions in which a page from that group was viewed one or more times. This is the exact equivalent of the Unique Pageviews metrics, but using Content Groups instead of Pages. Without content groups you’d need to define a new segment for each group, thus generating at least 12 reports if you need to see data for 12 groups of pages, while with content groupings this information is available with a single click.
The only downside of content groupings is that unlike segments they are not retroactive, but if you followed my planning advice from Part 1 you should have no issues with that in most cases.
Group-Level Statistics at a Glance
Another benefit of having content groups is found in the quick generation of group-level statistics. What would otherwise require you to generate at least one report per group, defining (sometimes complex) filters for each one, would now require a single click. A further benefit is that Content Grouping reports are pre-generated so you won’t hit sampling when using them in their basic form, same as any other main report in Google Analytics.
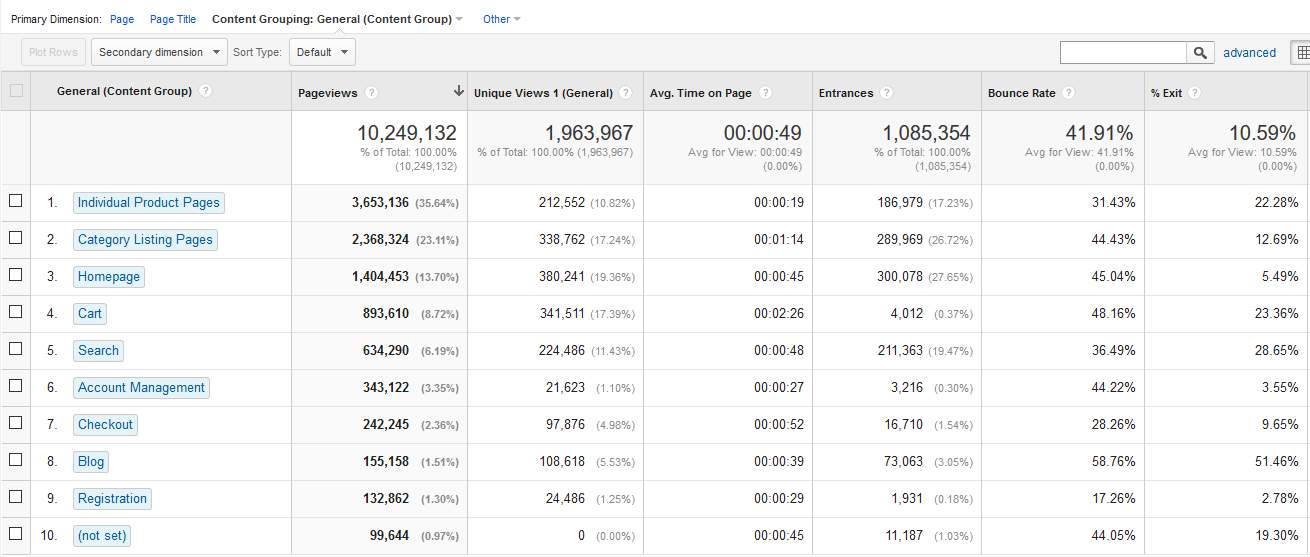
(click for full size)
Having a view as the above would allow you to quickly identify on a high-level which types of pages on your site gather most attention, where users enter and exit in largest numbers. This report is especially useful for spotting trends on the group-level, which might often be hard to spot without content groups. You can use both time range comparisons and the “plot rows” feature for that purpose.
High Level Navigation Summary Report
Here is where content groupings start to really shine. A typical scenario when looking at a navigation summary report is to be faced with hundreds if not thousands of unique URLs on each side (the previous path and next path sections), making getting useful data a challenging task, especially if Regular Expressions are not your thing yet (it should be, if you’re serious about Google Analytics!). How do you make sense of all the page data without running 10 or 15 filters on each side of the report, when each product URL is unique, you have unique order IDs in the checkout funnel? Content groupings give you the answer.
Let’s look at an example with an e-commerce site – here is how the data looks without content grouping applied:

(click for full size)
And is how it looks with content grouping:
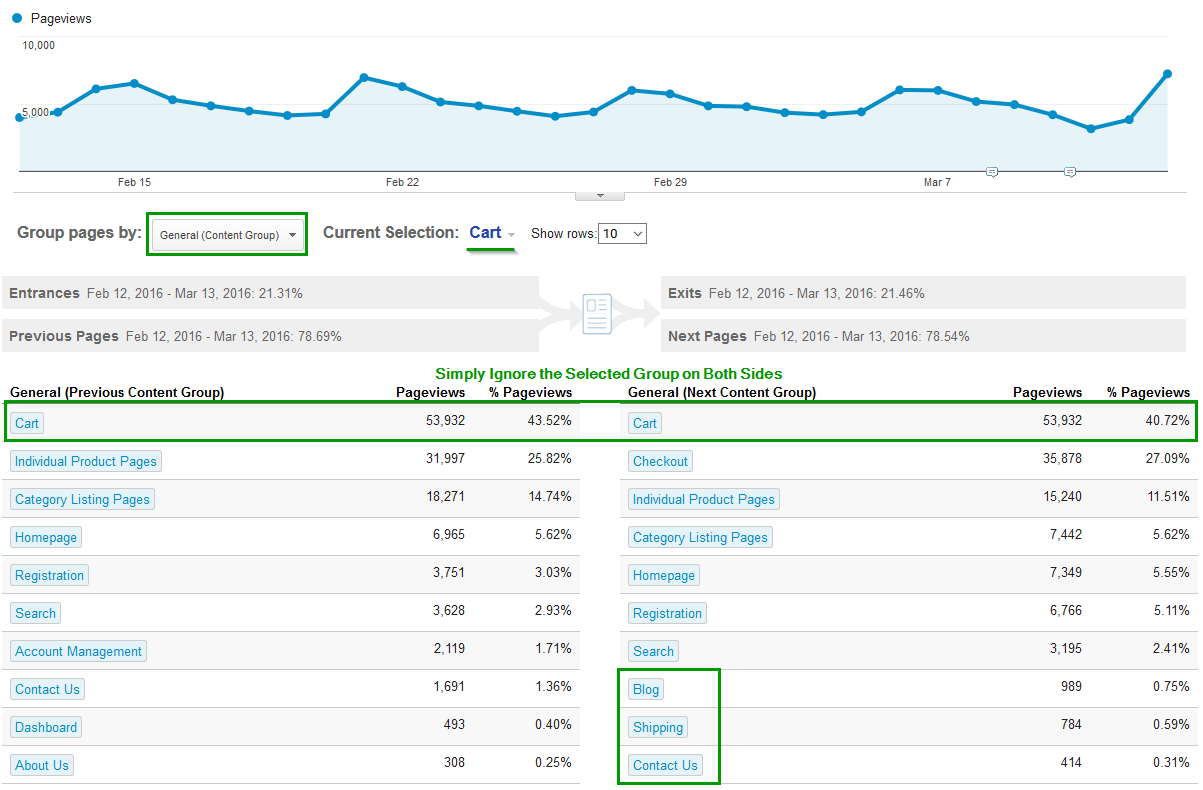
(click for full size)
Immediately groups like the checkout page group surfaced which was not even visible in the non-grouped view due to unique IDs in the URL, but it’s now on it’s appropriate 1-st position when viewed as a group. Search appeared as well and overall we have a much better idea of where are users are coming to the cart from and where they are heading to afterwards.
What you’ll notice is that the currently selected group is always present in the “previous content group section” as well as the “next content group” section with exactly the same number of pageviews. Just ignore those rows, as they don’t carry any information.
Rediscover the Behavior Flow Report with Content Groupings
Given that a lot of sites I work on are huge sites with tons of unique URLs and having the occasional marketing tracking tags (not utm_ tags) to put the cherry, the Behavior Flow report was mostly something I ignored in my work when it initially became available. The report was just a spaghetti-like mess that showed paths of fractions of the traffic.
The only way to squeeze any much needed high-level insights from that report seemed to be to have a dedicated view that has a lot of URL param stripping/rewriting in place. While this is still an option, Content Groupings are a much more manageable way to achieve the same result. Apply them to the Behavior Flow report and… voila: your site’s user paths lay beautifully laid in front of you.
Why does this section of the site has so high drop-off? Why people go from Group A to Group B and then back to Group A so often? Spotting user-flow patterns was suddenly an enjoyable task!
So that’s my take on content groupings and the 4 reasons why you should include them in your current Google Analytics setup. Do you have more? Care to share a general approach to content grouping you’ve found valuable? Feel free to hit the comment section below or to respond to the article on the social media channel of your choice!
About the author

Managing owner of Web Focus and creator of Analytics-toolkit.com, Georgi has over twenty years of experience in online marketing, web analytics, statistics, and design of business experiments for hundreds of websites.
He is the author of the book "Statistical Methods in Online A/B Testing", of white papers on statistical analysis of A/B tests, and has been a speaker at conferences, seminars, and courses. Georgi has been distinguished as a winner in the Data & Analytics category of the 2024 Experimentation Thought Leadership Awards.

