The Simpsons Paradox is an interesting issue for everyone dealing with data analysis, including web analytics specialists who deal with data in internet marketing. No matter which field you are in: conversion optimization, search engine optimization, search engine marketing or other, this paradox can give you an interesting insight.
The paradox is about proper test design when running a controlled test and it’s even more important to consider when doing observational work (looking at data in AdWords, Analytics, etc.). It’s a most startling example of what failure to segment by meaningful dimensions can lead to. “Segment, segment, segment!” is what this paradox teaches us.
The Simpson’s Paradox – an Example
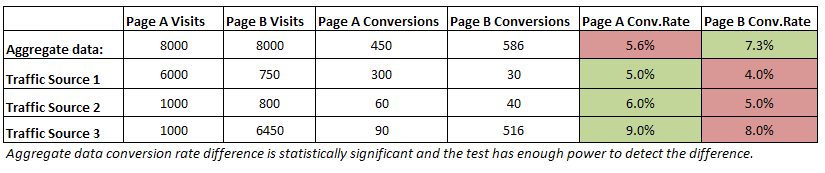
Let’s see a practical example: comparing conversion rate for Landing Page A and Landing Page B over several weeks. Here is the data:

Looking at the averages it seems B beats A with a significance level of 95% in a properly conducted test (has enough power, no optional stopping involved). It surely seems that we have a winner, right? However, segmenting the data by traffic source shows that Page A beats Page B for every single traffic source instance!
How is this Possible?
This peculiar effect is caused by weighted averages. The traffic source volume is, in this case, what is called a “lurking” variable or confounding variable. It is unevenly distributed between each traffic source/landing page couple and is in fact responsible for the observed results. This can easily move our test dangerously close to comparing apples to oranges.
What to Do in This Situation, What Page Variant to Choose?
First of all we should try to avoid getting into such a situation by using a properly randomized test. Another, and usually better option is to employ stratified sampling, but to my knowledge most tools do not offer such capabilities yet so that might not be an option. Then there is the observation study case in which we really don’t have control at all, e.g. organic search traffic.
If we are already in such a situation the decision on whether to act on the aggregate or on the by segment data is up to the story behind the numbers, not the numbers themselves.
My recommendation in the specific example is to refrain from making a decision with the data in the table. Instead, we should consider looking at each traffic source/landing page couple from a qualitative standpoint first. Based on the nature of each traffic source (one-time, seasonal, stable) we might reach a different final decision. For example, we may consider retaining both landing pages, but for different sources.
In order to do that in a data-driven manner, we should threat each source/page couple as a separate test variation and perform some additional testing until we reach the desired statistically significant result for each pair (currently we do not have significant results pair-wise).
Takeaway
Always segment your data based on meaningful dimensions. In case you have control of the segmentation – in a controlled conversion optimization test for example, try and spread the traffic randomly or use stratified segmentation. In case you are just observing AdWords or Analytics statistics, make sure to segment the data properly before you reach a decision.
About the author

Managing owner of Web Focus and creator of Analytics-toolkit.com, Georgi has over twenty years of experience in online marketing, web analytics, statistics, and design of business experiments for hundreds of websites.
He is the author of the book "Statistical Methods in Online A/B Testing", of white papers on statistical analysis of A/B tests, and has been a speaker at conferences, seminars, and courses. Georgi has been distinguished as a winner in the Data & Analytics category of the 2024 Experimentation Thought Leadership Awards.

