
The question “How to test if my website has a small number of users” comes up frequently when I chat to people about statistics in A/B testing, online and offline alike. There are different opinions on the topic ranging from altering the significance threshold, statistical power or the minimum effect of interest all the way to giving up on testing altogether. In this article I’ll discuss if it is worth to perform A/B tests with small numbers of users and talk about ways to go about it in an efficient way.
Why do we A/B test?
Let us start with a brief refresher on the two main reasons we might want to do a split test in the first place:
- To mitigate / manage the risk of a poor decision. E.g. we want to manage the risk of releasing an update to our shopping cart funnel which will reduce our average revenue per user.
- To estimate the effect size and direction (positive or negative lift) of a proposed change to the website or app. For example, we might want to know how much does including 5 additional photos per product increase our add to cart rate and/or purchase rate.
The duality of these two reasons is obvious since what is a “poor decision” is usually defined in terms of the actual effect size and effect direction of a proposed change. In the case of the shopping cart funnel update we would be happy if the estimate suggests that we won’t see a reduction in average revenue per user versus our existing one. In the case of the additional photos, if we assume the additional cost of taking, processing and hosting the extra photos would pay for itself if we see a 0.4% relative lift in add to the purchase rate we can frame it as a risk mitigation task: we want to manage the risk of making the poor decision of adding extra photos to all our products while they in fact lead to an increase in lift of less than 0.4%.
Regardless of how the goal is framed, conversion rate optimization experts always have a consideration for the return on investment (ROI) of the particular test when deciding whether to perform it and the what its statistical design should be. Weighing the costs and benefits is usually done through a risk-reward analysis which is where the small sample size needs to be factored in. We will be using this framework to shed light on the small sample size issue.
Small sample size: an issue for big business as well
Before we proceed to the meat of the matter I would like to make an important point:
The issue of having a very limited number of users to test with is not limited to small businesses.
While you certainly qualify for the small sample size case if your website only gets a couple of thousand of users per month or if your e-mail marketing list contains a couple of thousand emails, large and even gigantic corporations like Google, Microsoft, Amazon, Facebook, Netflix, Booking, etc. also face similar issues in many cases, despite the hundreds of millions of users they have to work with.
Consider, for example, that you are tasked with improving the UX of a feature which is only used by 0.2% of the users of the website or app which might see an overall usage of a hundred million users per month. For example, you might be working on the signup for advertisers. If advertisers are 0.2% of total users, this immediately limits the sample size you can work with to 200,000.
Since the signup is for new users only, we are down to 4,000 users per month who visit the ad signup section and are not customers already. Consider further, that the user experience you want to improve concerns only users on desktop devices – say 60% of total. You are down to a mere 2,400. Suddenly, you are in small sample size territory for this particular A/B test despite the 100 million overall users to the website/app.
The above example is with fictitious numbers, but one can easily find many real cases where the segment for which the user experience is to be improved is much smaller than the overall number of users to a website or app. In such cases it shares many of the issues and potential solutions faced by a small business. The most obvious difference between the above scenario and a small business is the availability of a testing platform and testing experts and know-how which are already in place and their cost is thus lower, but even that is not always the case.
With the above in mind, let us examine the problems we face when the feature we work on receives low amounts of traffic and thus few users and sessions are available to run tests with.
Problems with having a small number of users to test on
CROs and business owners usually become aware of the main problem of having a small number of users or sessions when they perform a sample size calculation and it reveals that it would take them many months (if not years) to perform a test with the chosen parameters, assuming the traffic stays at about the same level.
It is typical to perform the sample size calculation using the default 95% statistical significance and 80% statistical power and a minimum effect of interest of 5-10%, which would require between 50,000 and 500,000 users. The above numbers assume a baseline metric is a conversion rate between 2% and 5% and a fixed sample size test with only one variant tested vs. a control. You can use this statistical calculator to perform sample size calculations for different scenarios.
If, however, you properly understand what minimum effect of interest means and if even a 0.5% lift would be exciting to see from a given test, then the required sample size skyrockets to millions or tens of millions.
While bigger e-commerce websites may see 500,000 or 1,000,000 users in a month, a lot of small and medium-sized online merchants, SaaS businesses, consultant business, etc. may not see that many users in a whole year or even over several years. Testing for a month is something most would be on board with, but waiting for a year or several years to complete a test is not. The situation gets even worse when you want to test a change which only affects a segment of your overall users and even large businesses might end up having to deal with a small sample size, as illustrated in the previous section.
So, the main problem so far seems to be that A/B tests would take a lot of time to complete making testing seem impractical.
Is that really so?
Remember that we only reached this conclusion since we went with the “default” and “what seems reasonable” in terms of setting our error limits and minimum effect of interest. There were no calculations to back these up, to ensure that they are optimal in terms of business results, at least to the extent we can measure them.
Furthermore, we assumed that we are using a fixed-sample size test procedure and that the metric we are measuring performance by is the optimal one.
Let us see how challenging these assumptions in a more rigorous way might help us run ROI-positive tests even with a small sample size.
How to A/B test with a small sample size?
Let us see what possible ways there are to address the small sample size problem as explained above.
1.) Skip A/B testing?
Remember that we are testing for the primary reasons of estimation and business risk management. If none of these is a concern, there is scarcely any reason to A/B test. I can hardly think of any such situation aside from fixing obvious technical issues where the perceived risk of the fixes causing worse issues than the one they address is practically non-existent. In such scenarios you are likely better off skipping A/B testing entirely and simply implementing the fix.
A middle-ground between skipping testing and testing is to run a test with the goal of making sure that nothing dramatic will occur upon release. In such case you can perform a non-inferiority test with a large non-inferiority margin which will require a drastically smaller sample size while allowing you to mitigate the risk of a potential high-impact disaster. For example, a non-inferiority test with a 95% significance threshold and a non-inferiority margin of 20% would require only 12,000 to 35,000 users at 90% power and 8,500 to 23,000 users at 80% power. If still unfeasible a margin of 40% will slash these numbers almost in half.
Skipping the A/B test or performing a non-inferiority test with a large margin is something you should consider in such situations even if you have huge numbers of users to work with.
2.) Accept higher uncertainty
It should be well-known that we can lower the required sample size by:
- reducing the confidence threshold / increasing the significance threshold – accepting higher risk of false positives;
- increasing the minimum effect of interest (MEI/MDE) *;
- by accepting the test will have lower power against a particular MEI *;
* thus, the procedure will result in a higher false negative rate against a range of possible true effect sizes.
The second and third option are equivalent and interchangeable. All three result in higher uncertainty and greater risk of either false positives or false negatives.
The question is how much uncertainty of either type we can tolerate and still be happy with the trade-off between certainty and speed of testing (sample size). In other words, will it be better to test for 12 weeks if this way you have 80% probability of seeing a statistically significant outcome at the 95% confidence level if the true effect is larger than X, or should you instead run the test for only 6 weeks with a confidence level of 80%? Or maybe you should test with 80% confidence threshold for 12 weeks to increase statistical power and thus reduce the risk of a false negative?
The first leads to less risk of loses due to implementing a winner after the A/B test is completed, but it also exposes you to larger risk during testing. The second limits the risk during testing while increasing the risk after testing. Finally, the third one limits the risk of failing to detect a true improvement of a smaller magnitude while keeping risk during testing the same, but trades that for increased risk of implementing something which actually harms performance.
It is actually quite hard to answer this question due to circular feedback from tweaking the parameters and the fact that the answer requires encoding intuitions and predictions about the effect size into a probability distribution / frequency distribution. The latter is a non-trivial task some argue it cannot be done in a coherent manner while those who defend the practice are split about the correct way to approach the problem.
If you believe you can handle this task, then try our A/B Test ROI calculator – currently the only tool I’m aware of which can help you balance risk and reward and arrive at an optimal significance threshold and sample size in terms of return on investment.
3.) Use a sequential testing procedure
Using sequential testing statistics is a long-term strategy which can result in 20%-80% faster tests, meaning that a sequential test would, on average, require 20% to 80% fewer users to conduct compared to an equivalent fixed-sample size test. These exact numbers pertain in particular to the AGILE A/B testing method I proposed some time ago and implemented in Analytics-Toolkit’s A/B testing calculator. It is a procedure in which one monitors the data as it gathers and uses two non-symmetrical stopping boundaries: one for efficacy and one for futility which allow one to stop a test mid-way if a boundary is crossed. Other approaches will see a different mileage.
There are trade-offs in sequential testing, too. Under the worst possible circumstances certain tests might continue on for longer than an equivalent fixed sample size test would have taken. Also, while the procedure is sound from the decision-theoretic perspective and should result in a testing strategy which is optimal in the long run, its usage is more difficult to justify from a purely inferential standpoint (work in progress).
4.) Use conversion to next step as primary KPI
Something which I don’t recall hearing or reading anywhere else is an advice I’ve given a year or two back in my CXL Institute course on statistics in A/B testing. It is to see if it makes sense to measure the outcome from the step you are optimizing in terms of people who make it to the next step, e.g. adding a product to cart or starting the checkout, instead of in terms of the final measurable outcome, e.g. purchase rate or average revenue per user.
Without going into much detail as you can verify this using the sample size calculator suggested above, the reasoning is that the signal to noise ratio in that metric will be better than the traditional one and thus allow for faster testing. Let me know in the comments if you’d like more info on this option.
As with the other 3 options above, there is a trade-off: the metric you are using is not the one closest to the business bottom-line which means that the effect might dissipate, entirely disappear or even reverse itself on following steps. I can imagine many situations in which the assumption that you can use this method with a low risk of the above happening, but there are also situations in which it would be a great mistake to make that assumptions, e.g. when you use discounts to increase the add to cart and/or checkout start conversion rate.
No free lunch
As you can see, no matter if you go for 1, 2, 3, or 4, or a combination of them, there is always a trade-off. There is simply no such thing as a free lunch.
Economics of testing: small sample size vs. large sample size
We will end this post with an example of how the risk-rewards analysis works out when testing with small versus large number of users.
Many people are under the wrong impression that as long as you have millions of users to test on each month, you can get great precision and very narrow confidence intervals around any estimate of interest. What this thinking fails to take into account is that achieving a certain sample size, regardless of how long it takes, increases the risk of loses during testing and decreases the utility of implementing a true winner as the more users we test on, the fewer users we deploy to.
Furthermore, a 0.1% lift might not even justify the cost of the A/B test for a small website with modest amounts of revenue, however a 0.1% lift for the likes of Amazon or Google may equal hundreds of millions over a year or two. Similarly, a 0.1% decline can really damage a big business, thus a big business would require higher error guarantees. Detecting such minuscule improvements at low significance thresholds / high confidence levels requires amounts of users which become an issue even when testing on the largest of websites.
There are also those who think that having 100 million users a month means you can run most tests in a day or two. What is forgotten is that you can only test so fast before you run the risk of a greatly increased threats to the generalizability of the outcomes. Even though the sample size calculation might say you can run an A/B test in 2 days with the amount of traffic you have, external validity concerns would dictate you run the test for at least 7 days. Failure to do so is likely to take this into account will likely lead to poor predictive power.
Still, having some economies of scale on your side is beneficial. For this example, let us say we are testing exactly the same intervention on a big site (S1) with 500,000 users per week and $500,000 in weekly revenue, as well as on a small site (S2) with 50,000 users per week and $50,000 in weekly revenue. We expect the change, if implemented, to persist for about 4 years and we estimate the cost to run the test to be $1,000 for S1 and $600 for S2 (S2 pays more for testing software, can’t share expertise as well, etc. leading to the higher cost). Both have a baseline purchase rate of 5% and we use a fixed sample test for simplicity.
The following comparison can be made:
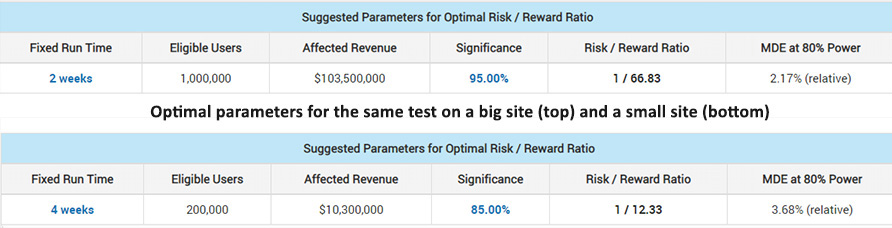
As you can see for the larger business S1 it is optimal to test for only 2 weeks, but with 5 times more users and at 3 times smaller significance threshold (0.05 vs 0.15). It also allows it to maintain 80% power to detect a significantly smaller true lift – 2.17% vs 3.68%. The smaller business S2 would need to test longer and at a higher significance threshold, thus a lower confidence level. Even so its risk/reward ratio is multiple times worse than that of the larger business: 1/12.33 vs 1/66.83.
Even if we run the calculation by scaling the cost of testing linearly with the size of the business ($1,000 for S1 and $100 for S2), the bigger business still gets a maximum risk-reward ratio 40% better than the smaller one.
Of course, a smaller business can have beneficial characteristics which eliminate this disadvantage, e.g. being more agile, faster to test and quicker to spot an issue and reverse course if things go wrong despite A/B testing.
What we have learned about testing with small sample sizes
Due to the economics of scale and the reality of statistical estimation, the smaller a business is, the less likely it is to have a positive expected ROI from A/B testing. A larger business seems to be more likely to benefit from A/B testing before implementing. I do not think it is a coincidence that the companies investing most heavily in testing are also the biggest businesses around: when they do A/B testing right they can get more per dollar spent or risked than most others, even if both do things the same way.
While having a small number of users, sessions, or emails to test with certainly comes with disadvantages, they are not always as insurmountable as they may seem initially. For as long as testing makes business sense you can tweak different parameters to take certain trade-offs and still use A/B testing efficiently, both for estimation and for risk management.
You can take a disaster prevention approach with certain non-inferiority designs, you can accept a higher uncertainty of one type or the other, you can test with sequential testing statistical methods, or use an alternative KPI when it makes sense. None of these are solutions unique to a small sample size situation as these are all things which can increase the efficiency of different kinds of tests. I think, however, that these options are more of a necessity if your sample size appears prohibitively small.
If you enjoyed this article, I’d appreciate if you share it with others who might benefit from it.
About the author

Managing owner of Web Focus and creator of Analytics-toolkit.com, Georgi has over eighteen years of experience in online marketing, web analytics, statistics, and design of business experiments for hundreds of websites.
He is the author of the book "Statistical Methods in Online A/B Testing" and white papers on statistical analysis of A/B tests, as well as a lecturer on dozens of conferences, seminars, and courses, including as a Google Regional Trainer.


Gerogi hi!
Im currently working with a team that is building different ML models for sorting products on Product List Pages with the goal of generating a lift in visits with purchase. I’ve been stating that there is so much noise between PLP pages to sales (different cross device searches, non linear browsing, long time-to-purchase in certain categories, and so) that it would be better to measure CTR instead.
Moreover, since each PLP has different Conversion rate distributions, they are evaluating measuring each PLP as a separate experiment, which really decreases sample size overall.
Any advice on signal to noise ratio since you mention it on the post? Any particular good read to reccomend? Thanks a lot in advance!
Hi Ezequiel,
It all depends on the goals of the tests being conducted. For certain purposes, what you’re currently doing can be the right thing to do, in other scenarios evaluating all PLPs in a single experiment would be the right way forward. CTR can be a decent first measure of success, but in many ways it would not be an interesting metric in itself. It all depends on the end goal of each test. As for reading – I’d recommend you check out my book “Statistical Methods in Online A/B Testing”, where you can find a detailed description of how A/B testing fits in business decision making and risk management. This and other things in the book should help you come up with the right test for your situation.
Great, will do! Thanks Georgi!