A long awaited and quite awesome feature is finally here in open beta for all Google Analytics accounts: Calculated Metrics! As a long-time power user I’ve been longing for this for quite some time since I had to resort to spreadsheets or API-based solutions (like our Agency Dashboard tool) when I needed to calculate my own metrics based on the standard metrics GA has. When things like Revenue per User, Conversions per User or Site Searches per User where of interest there was no other option. Now there is, thanks to calculated metrics.
Calculated metrics allow you to compute metrics based of the standard metrics in Google Analytics in order to come up with data that better aligns with your measurement needs and helps you answer the important questions that drive action much easier. Once you create a calculated metric it starts functioning as any other metric in your reports – gathering data from the moment you define it onward. There are some differences, though, as you can use calculated metrics in custom reports and custom dashboards, but sadly not in Custom Segments (as of moment of writing at least). Also you’re limited to just 5 calculated metrics per view for free accounts (50 for Premium accounts). I guess this is one more reason to use up that view quota.
Read below on how to set up your first calculated metric and 10 awesome examples of calculated metrics you’d want to use.
How to set up a calculated metric in Google Analytics?
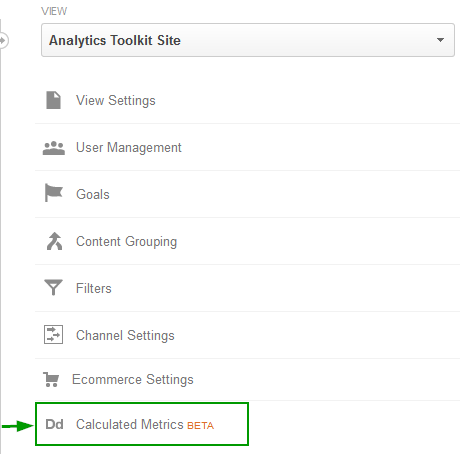
1.) Go to Admin, select the view you want to set the metrics for and click the “Calculated metrics” button:
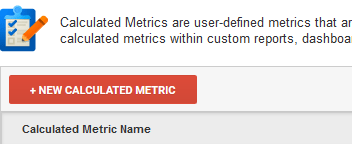
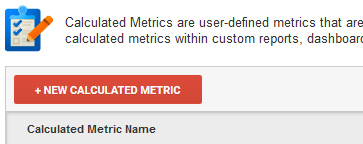
2.) Click on the “New Calculated Metric” button:
3.) Set up your metric:
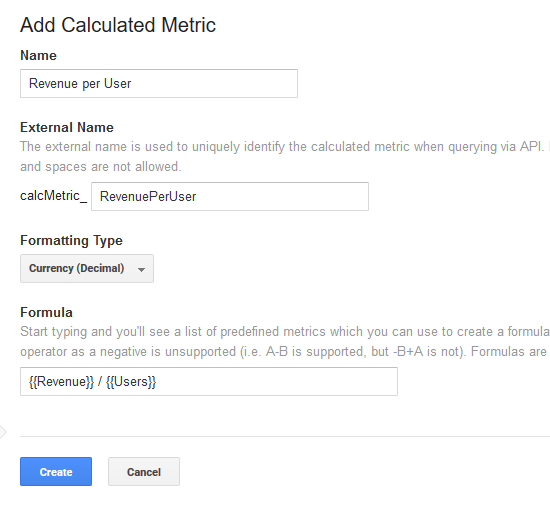
Now this is the harder part. First enter a name for your new metric. Make it short, but descriptive. As you can see GA automatically fills in the “External Name” field based on your input in the “Name” field. You can, however, type in this field directly as well, but bear in mind the restrictions that apply. The External Name can NOT be changed once the metric is created, while you can change the Name anytime you want.
Next you should select the proper formatting type. Available values are “Float”, “Integer”, “Currency”, “Time” and “Percent”. These should be pretty self-explanatory. Make sure to select the proper type though, otherwise it may lead to unpredictable or just plain wrong results.
Finally the most interesting part – the FORMULA. This field should include the fields you want to operate on and simple arithmetic operators. Just start typing and Google Analytics will suggest metric names based on what you’ve typed so far. In the example calculated metric above we have one of the very first metrics you’d want to have for e-commerce sites – revenue per user. The formula for it is {{Revenue}} / {{Users}} . Now let’s see some other great examples of calculated metrics:
10 awesome calculated metrics
1.) User-based Goal Conversion Rate
Name: User Goal CR
Type: Percent
Formula: {{Goal Completions}} / {{Users}}
This can be altered to work for just a specific goal. In the case of Goal 1 the formula would be:
{{Goal 1 Name (Goal 1 Completions)}} / {{Users}}
Don’t copy the above formula, as you’d need to use your actual goal name.
This can also be made to work for a set of goals, say 1 and 2 only:
({{Goal 1 Name (Goal 1 Completions)}} + {{Goal 2 Name (Goal 2 Completions)}})/ {{Users}}
Don’t copy the above formula, as you’d need to use your actual goal names.
2.) User-based E-commerce Conversion Rate
Name: User E-comm CR
Type: Percent
Formula: {{Transactions}} / {{Users}}
3.) Revenue per User
One of the best calculated metrics for e-commerce sites.
Name: Revenue per User
Type: Currency
Formula: {{Revenue}} / {{Users}}
4.) Avg. User Duration
Name: Avg. User Duration
Type: Time
Formula: {{Session Duration}} / {{Users}}
5.) Searches per User
Very useful for sites where search plays an important role:
Name: Searches per User
Type: Float
Formula: {{Total Unique Searches}} / {{Users}}
6.) Sessions with Search per User
Great for estimating in how many sessions user perform a search:
Name: Sess. with Search per User
Type: Float
Formula: {{Sessions with Search}} / {{Users}}
7.) Transactions per User
Name: Transactions per User
Type: Float
Formula: {{Transactions}} / {{Users}}
8.) Product Clicks per Session
If you have Enhanced E-commerce set up this metric will give you the average number of product list clicks per session. Can be altered to be user-based as well.
Name: Product Clicks per Session
Type: Float
Formula: {{Product List Clicks}} / {{Sessions}}
9.) Product Views per Session
While this is similar to #8, it includes product views that didn’t occur as a result of clicks on product lists, e.g. a user has landed on your product view page.
Name: Product Views per Session
Type: Float
Formula: {{Product Detail Views}} / {{Sessions}}
10.) Product Views per Transaction
If you have Enhanced E-commerce set up this metric will help you estimate how many products are viewed on average in order to complete a transaction.
Name: Product Views per Transaction
Type: Float
Formula: {{Product Detail Views}} / {{Transactions}}
We hope these metrics give you good start in using calculated metrics in Google Analytics. If you’re still wondering how they will appear in your reports, read on.
How to use calculated metrics?
As said in the beginning you can use calculated metrics in two ways – as a metric in a custom report or as a metric for a custom dashboard widget. Here is an example report configuration featuring some of the proposed 10 metrics above:
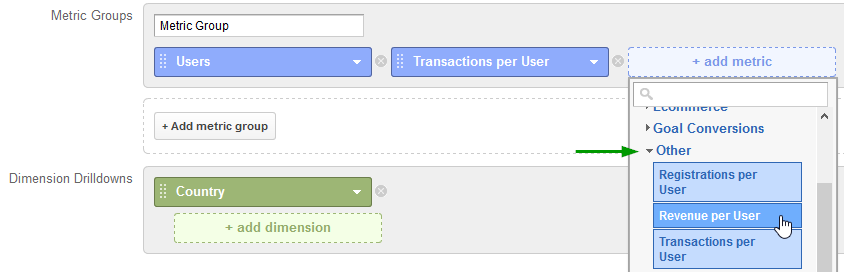
The metrics you’ve created would be grouped under “Other” in the metrics drop-down.
Unfortunately we can’t use them for custom dimensions or in-report filters, but we hope this functionality will be implemented in Google Analytics in the months to come.
About the author

Managing owner of Web Focus and creator of Analytics-toolkit.com, Georgi has over eighteen years of experience in online marketing, web analytics, statistics, and design of business experiments for hundreds of websites.
He is the author of the book "Statistical Methods in Online A/B Testing" and white papers on statistical analysis of A/B tests, as well as a lecturer on dozens of conferences, seminars, and courses, including as a Google Regional Trainer.
